Food-Processing FDI Outweighs Farm Investment Across Southeast Asia’s Agrifood Sector
July 5, 2026
We document that the two series routinely reported as 'Southeast Asian FDI' diverged over 2020-2024 in both direction and composition.
Announced greenfield project value (fDi Markets) rose to a record USD 175.1 billion in 2023, up 55.8% on 2022, in the same year that realized balance-of-payments inflows to ASEAN fell about 10% to USD 208 billion; in 2024 the signs reversed, with realized inflows up 8% to USD 226 billion while announced greenfield came off its peak.
The gap is definitional, not error: the two answer different questions, and USD 143 billion of the 2024 realized total accrued to Singapore, roughly 60% of it in finance.
Abstract. We document that the two series routinely reported as “Southeast Asian FDI” diverged over 2020-2024 in both direction and composition, so that the same year can look like an acceleration or a contraction depending on which one is quoted. Announced greenfield project value, the forward-looking capital-expenditure series compiled by fDi Markets, rose to a record USD 175.1 billion in 2023, up 55.8% on 2022, in the same year that realized balance-of-payments inflows to ASEAN fell about 10% to USD 208 billion. In 2024 the signs reversed: realized inflows rose 8% to USD 226 billion while the announced greenfield value came off its peak. The gap is not measurement error. The two numbers answer different questions, and the larger of them, realized inflows, is the one least about new factories: USD 143 billion of the 2024 total accrued to Singapore, roughly 60% of it in finance.
The record and the shortfall arrived in the same year
Start with the fact that motivates the piece. In 2023 the value of greenfield projects announced for ASEAN reached USD 175.1 billion, the highest on record and 55.8% above the USD 112.4 billion of 2022, after two flat years near USD 69 billion (ASEAN Investment Report 2024, from fDi Markets). Read on its own, that series says foreign investors were committing to the region at an unprecedented rate. Yet balance-of-payments inflows, the money the central banks actually recorded crossing the border, moved the other way that year, easing from USD 231 billion in 2022 to about USD 208 billion in 2023 on UNCTAD’s revised figures.
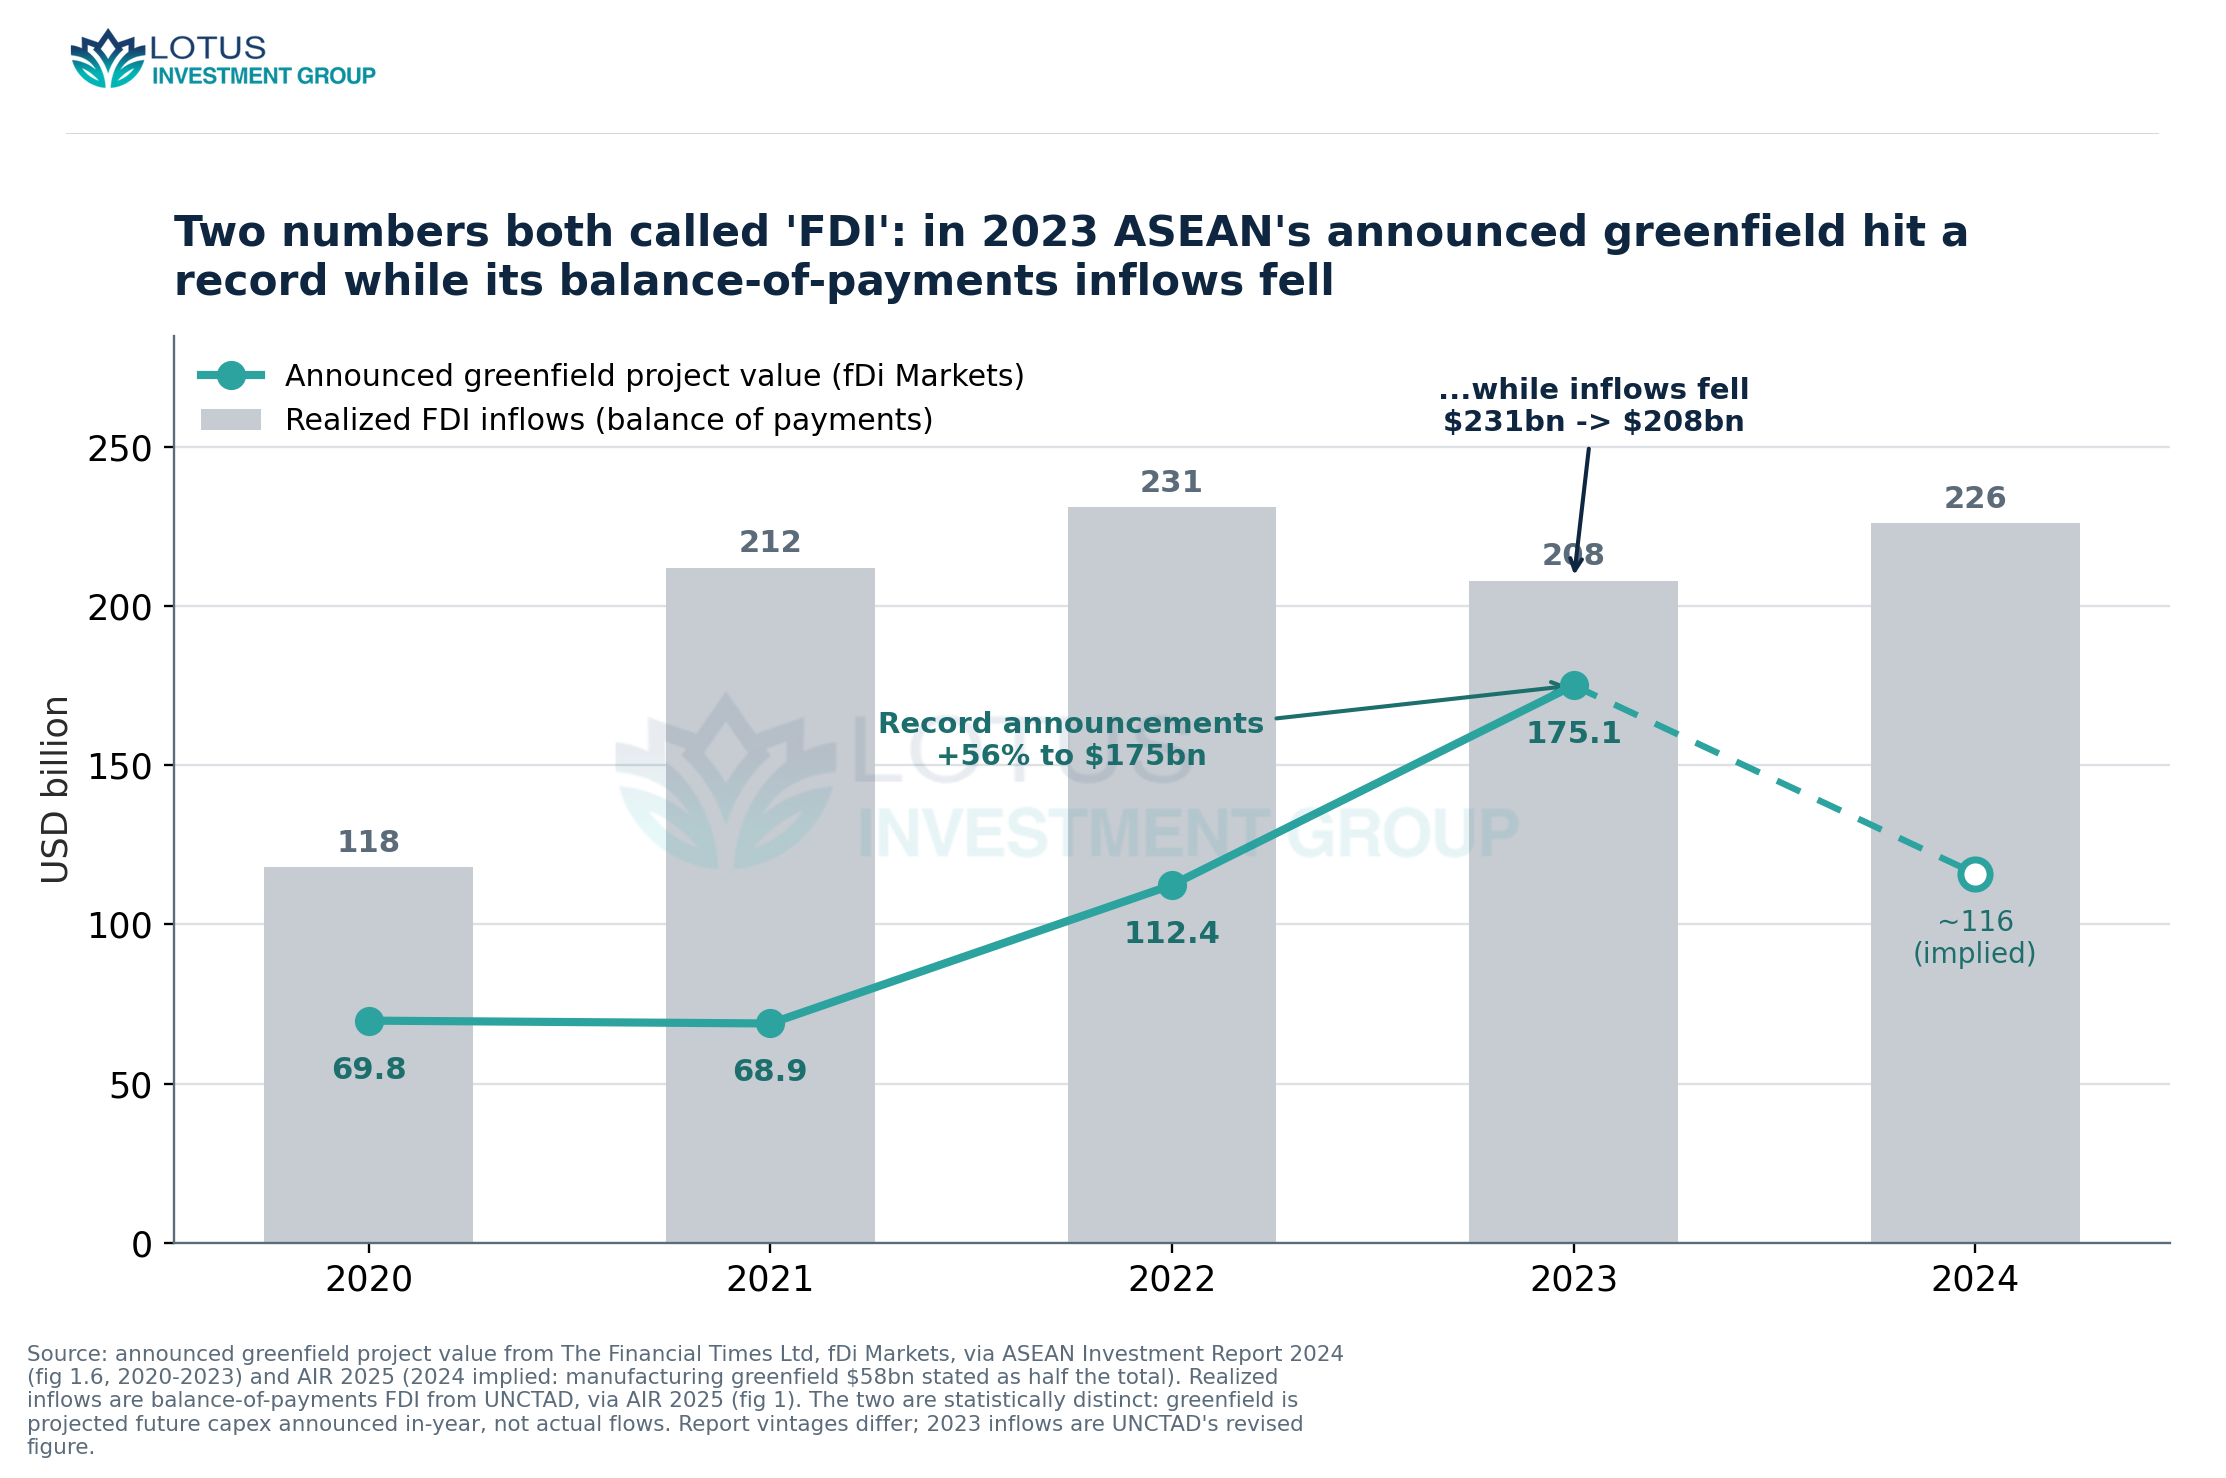
An analyst quoting the greenfield line would have described 2023 as a breakout; one quoting the balance of payments would have described it as a soft year. Both were reading a real, official number. The point is not that one is wrong but that they are not the same measurement, and the distance between them is large enough that the choice of series changes the story.
Two databases, two questions
UNCTAD is explicit about why. Its own methodology treats greenfield announcements, international project finance, and cross-border M&A as three project databases that are “statistically distinct from FDI data based on the balance of payments,” and notes that greenfield figures “include estimates for projected capital expenditures in the future, not actual financial flows in the reporting year” (World Investment Report 2025). The greenfield series is sourced from The Financial Times Ltd, fDi Markets; the balance-of-payments series is compiled by central banks under the IMF’s flow definitions. One counts an intention, priced at the capital a company says it will eventually spend building something. The other counts a settlement, the equity, reinvested earnings, and intra-firm debt that actually moved in the year.
Setting the four numbers side by side for 2024 makes the mismatch concrete.
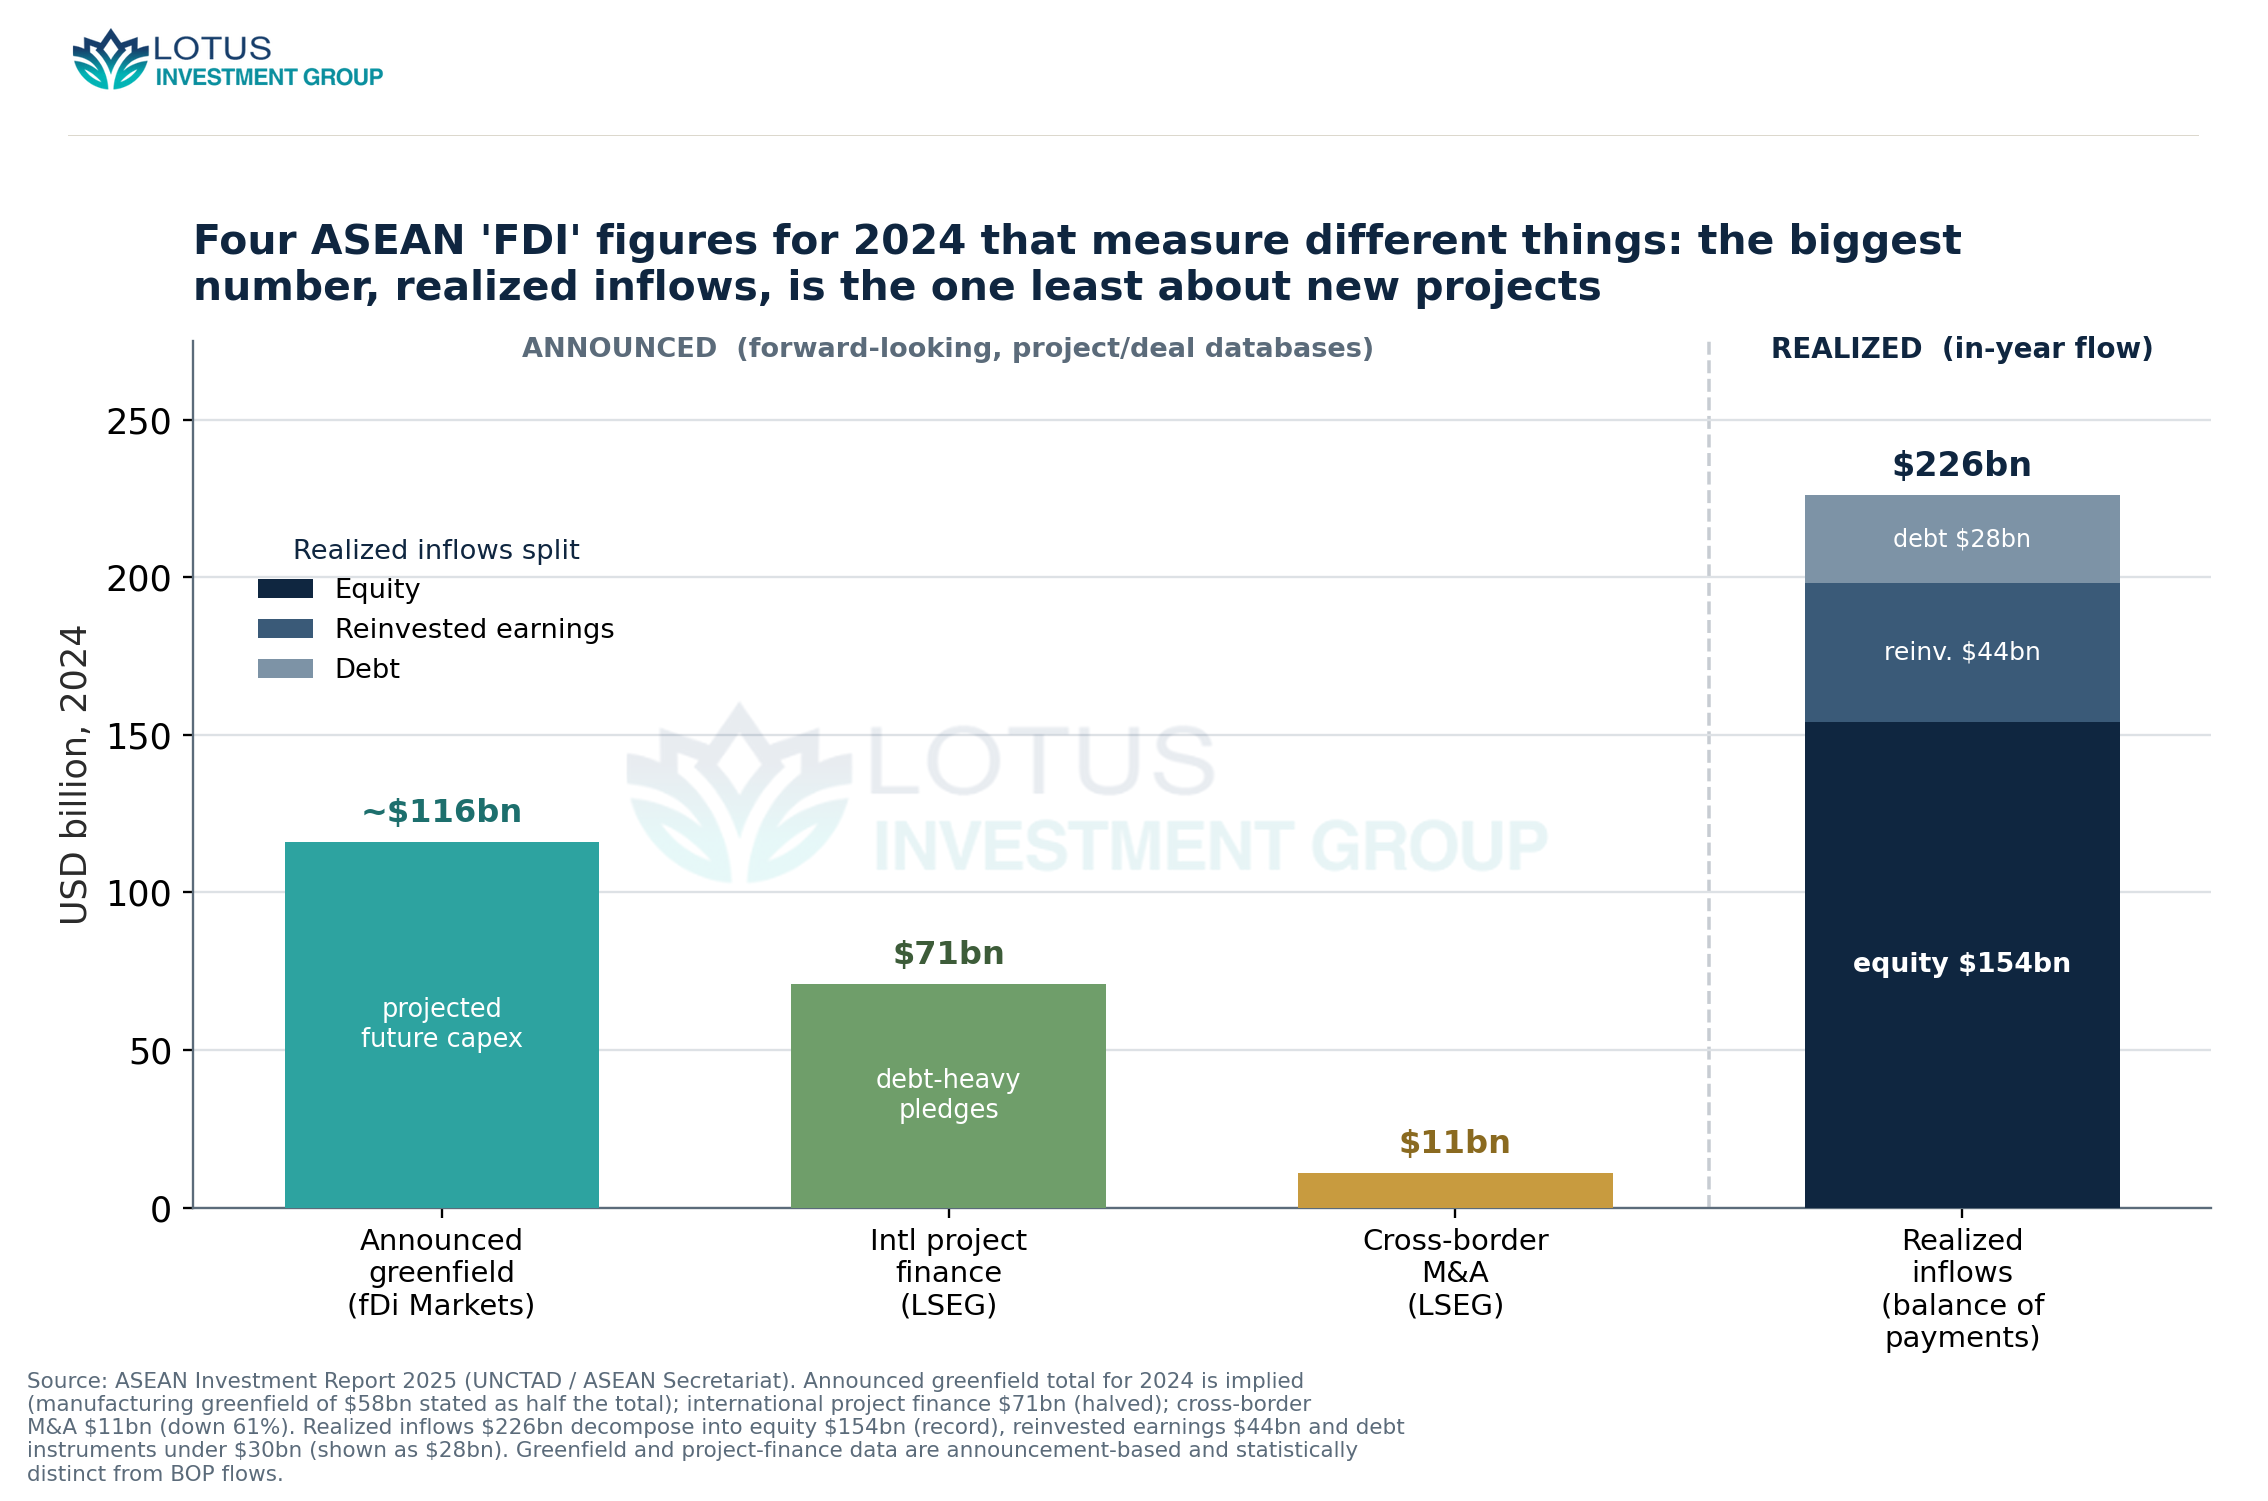
On the announcement side, ASEAN’s greenfield manufacturing pledges fell by nearly half to USD 58 billion, which AIR 2025 states was half of the total announced greenfield value, implying a total near USD 116 billion; international project finance halved to USD 71 billion; and cross-border M&A fell 61% to USD 11 billion. On the realized side, balance-of-payments inflows rose to USD 226 billion, of which equity injections reached a record USD 154 billion, more than two thirds of the total, with reinvested earnings of USD 44 billion and intra-company debt under USD 30 billion. The realized figure is by far the largest, and it is dominated by equity that need not correspond to any announced project at all.
The realized number is a Singapore-and-finance story
The reason the balance-of-payments total runs above the greenfield pipeline is geographic and sectoral concentration. Of the USD 226 billion that ASEAN recorded in 2024, USD 143 billion, a record and about 63% of the regional total, went to Singapore. Within Singapore, finance was the largest recipient at USD 87 billion, 60% of its inflows, and professional and technical activities, which include holding companies, added USD 22 billion (ASEAN Investment Report 2025).
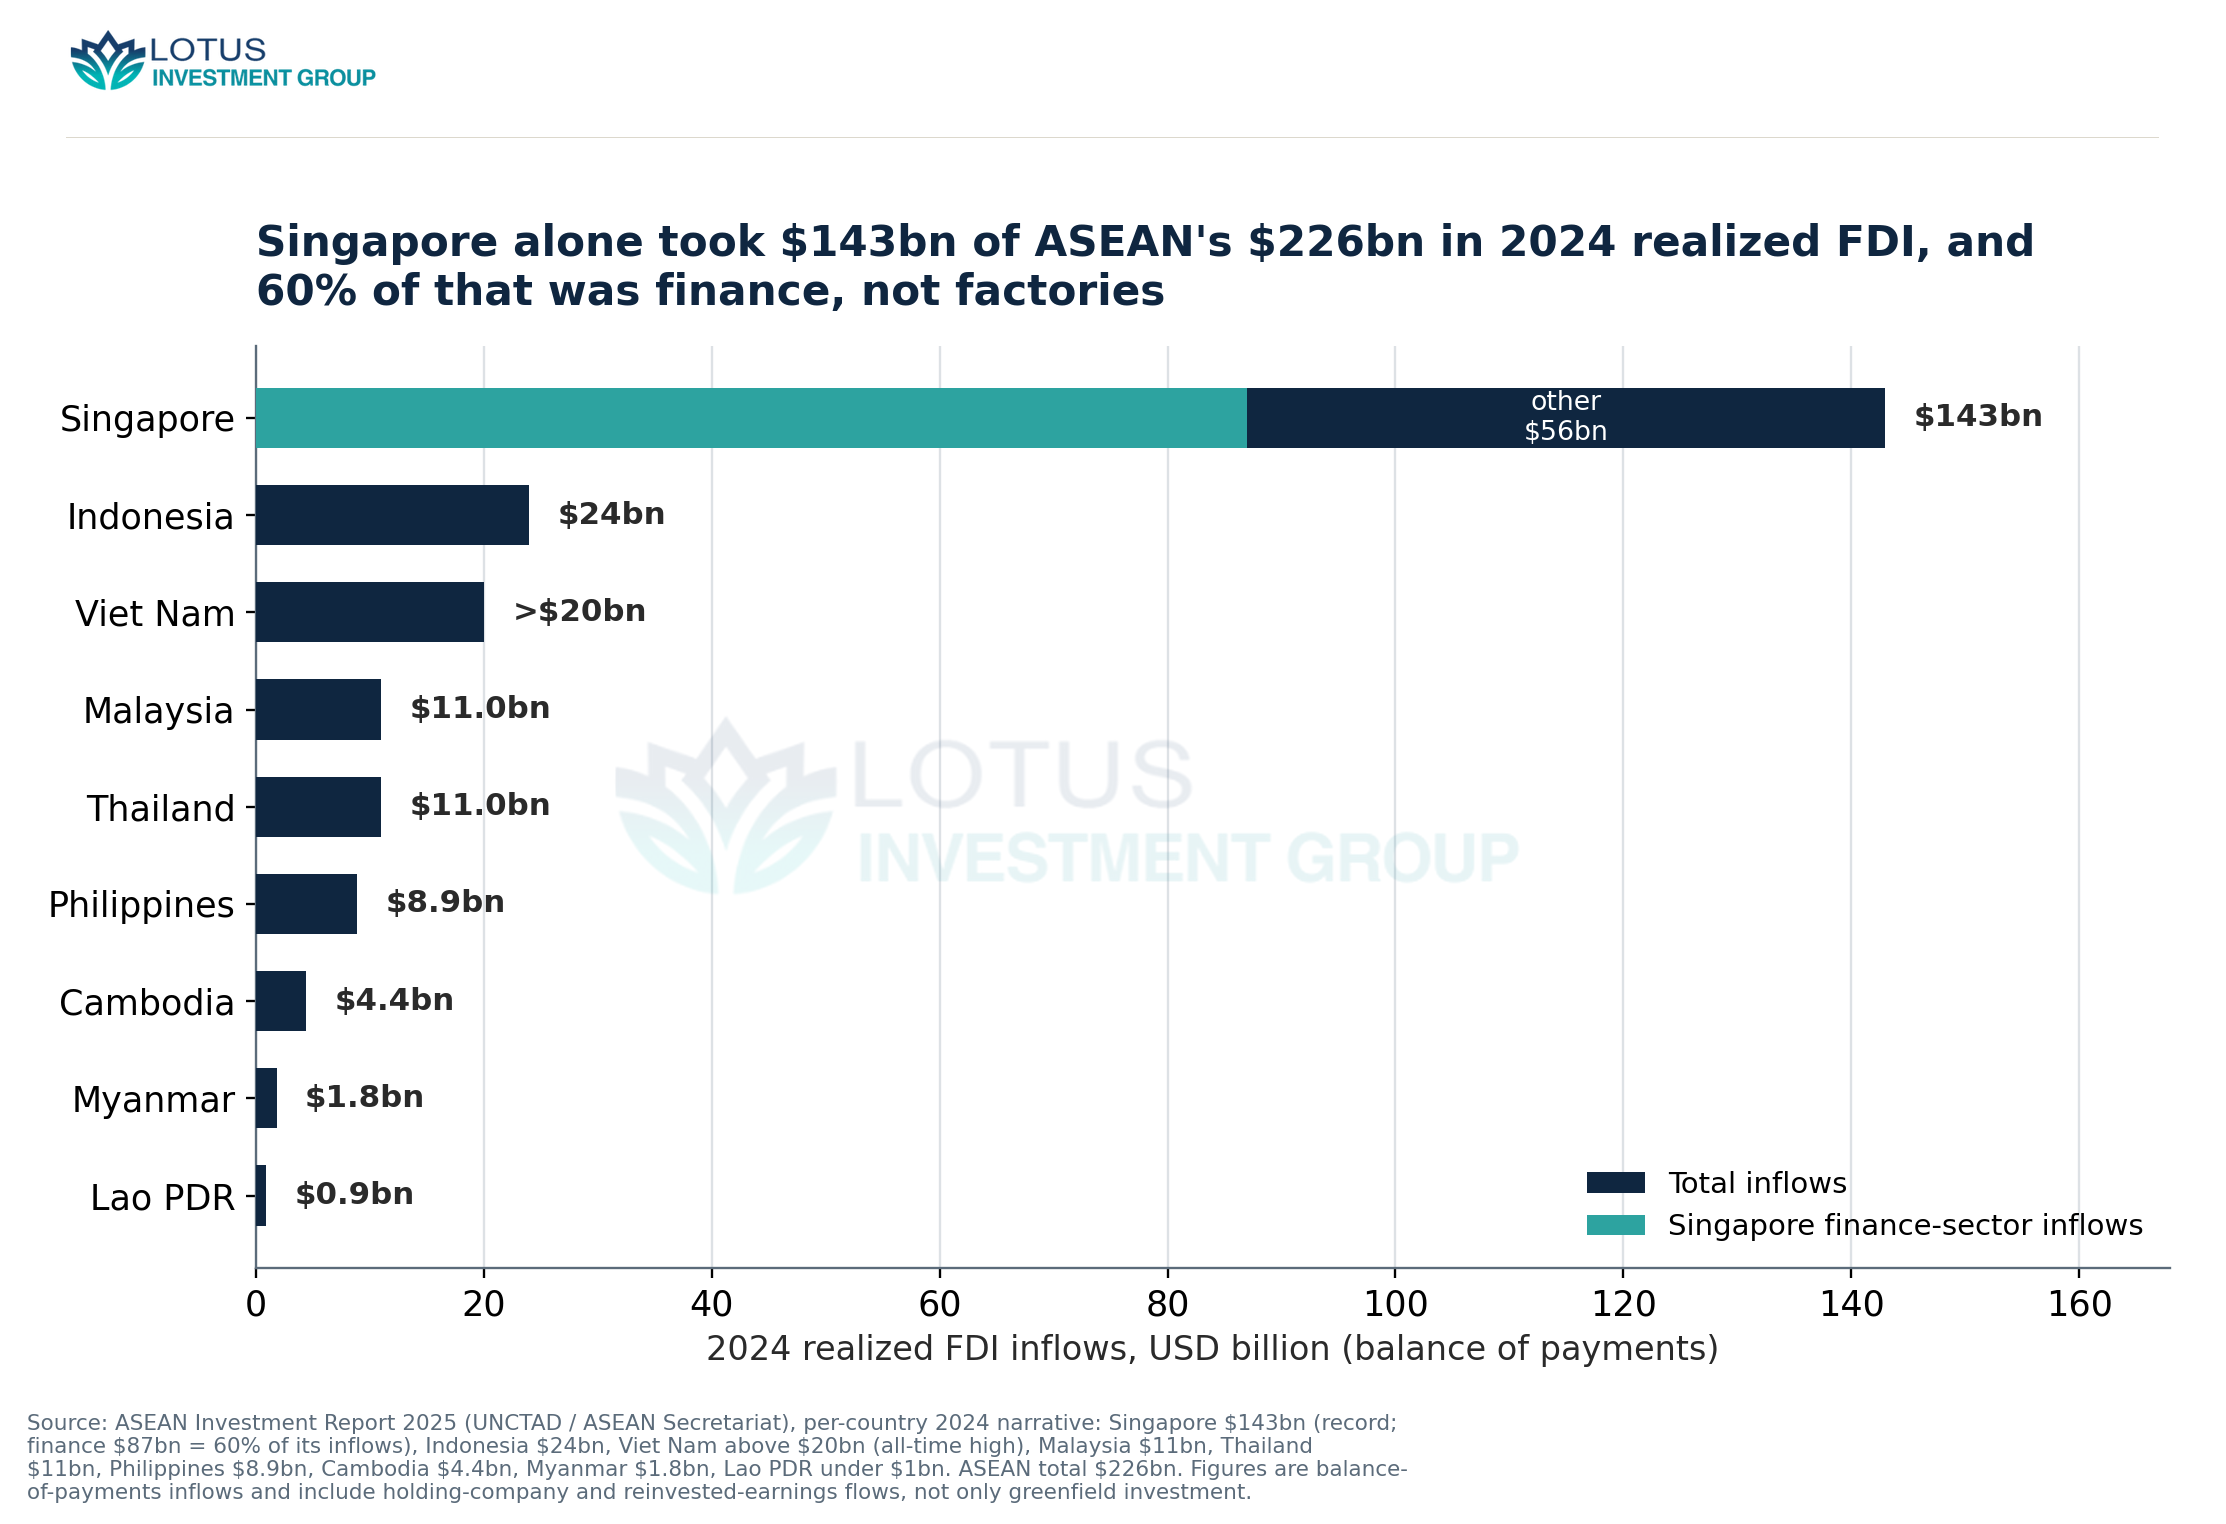
That composition tells you the aggregate realized number is not measuring the same thing the greenfield series describes. Greenfield announcements are overwhelmingly physical, with about half of ASEAN’s in manufacturing against a global share near 44%, led in 2024 by electronics and electrical equipment at USD 31 billion and by information and communication at USD 30 billion. The balance-of-payments total, by contrast, is carried by equity booked in a financial entrepôt, some of it holding-company activity that will be on-invested elsewhere and some of it, on UNCTAD’s account, sensitive to a few large investors; United States inflows into Singapore fell 55% to USD 37 billion in 2024 on lower holding-company activity, the kind of swing that has little to do with whether a factory opened. Strip Singapore out and the productive-economy recipients are an order of magnitude smaller, with Indonesia at USD 24 billion, Vietnam just above USD 20 billion, Malaysia and Thailand at USD 11 billion each, and the Philippines flat at USD 8.9 billion. These are the economies where the greenfield pledges are supposed to land, and their realized inflows are a small fraction of the regional headline.
Announcements are a lumpy leading indicator, not a forecast
If the greenfield series is not a realized flow, is it at least a reliable signal of the flow to come? The 2020-2024 record suggests it is directional but noisy, and that its dollar value and its project count can diverge. The number of announced projects rose every year, from 762 in 2020 to a record 1,638 in 2024, a 4% gain even in the year the dollar value fell. Value peaked a year earlier, in 2023.
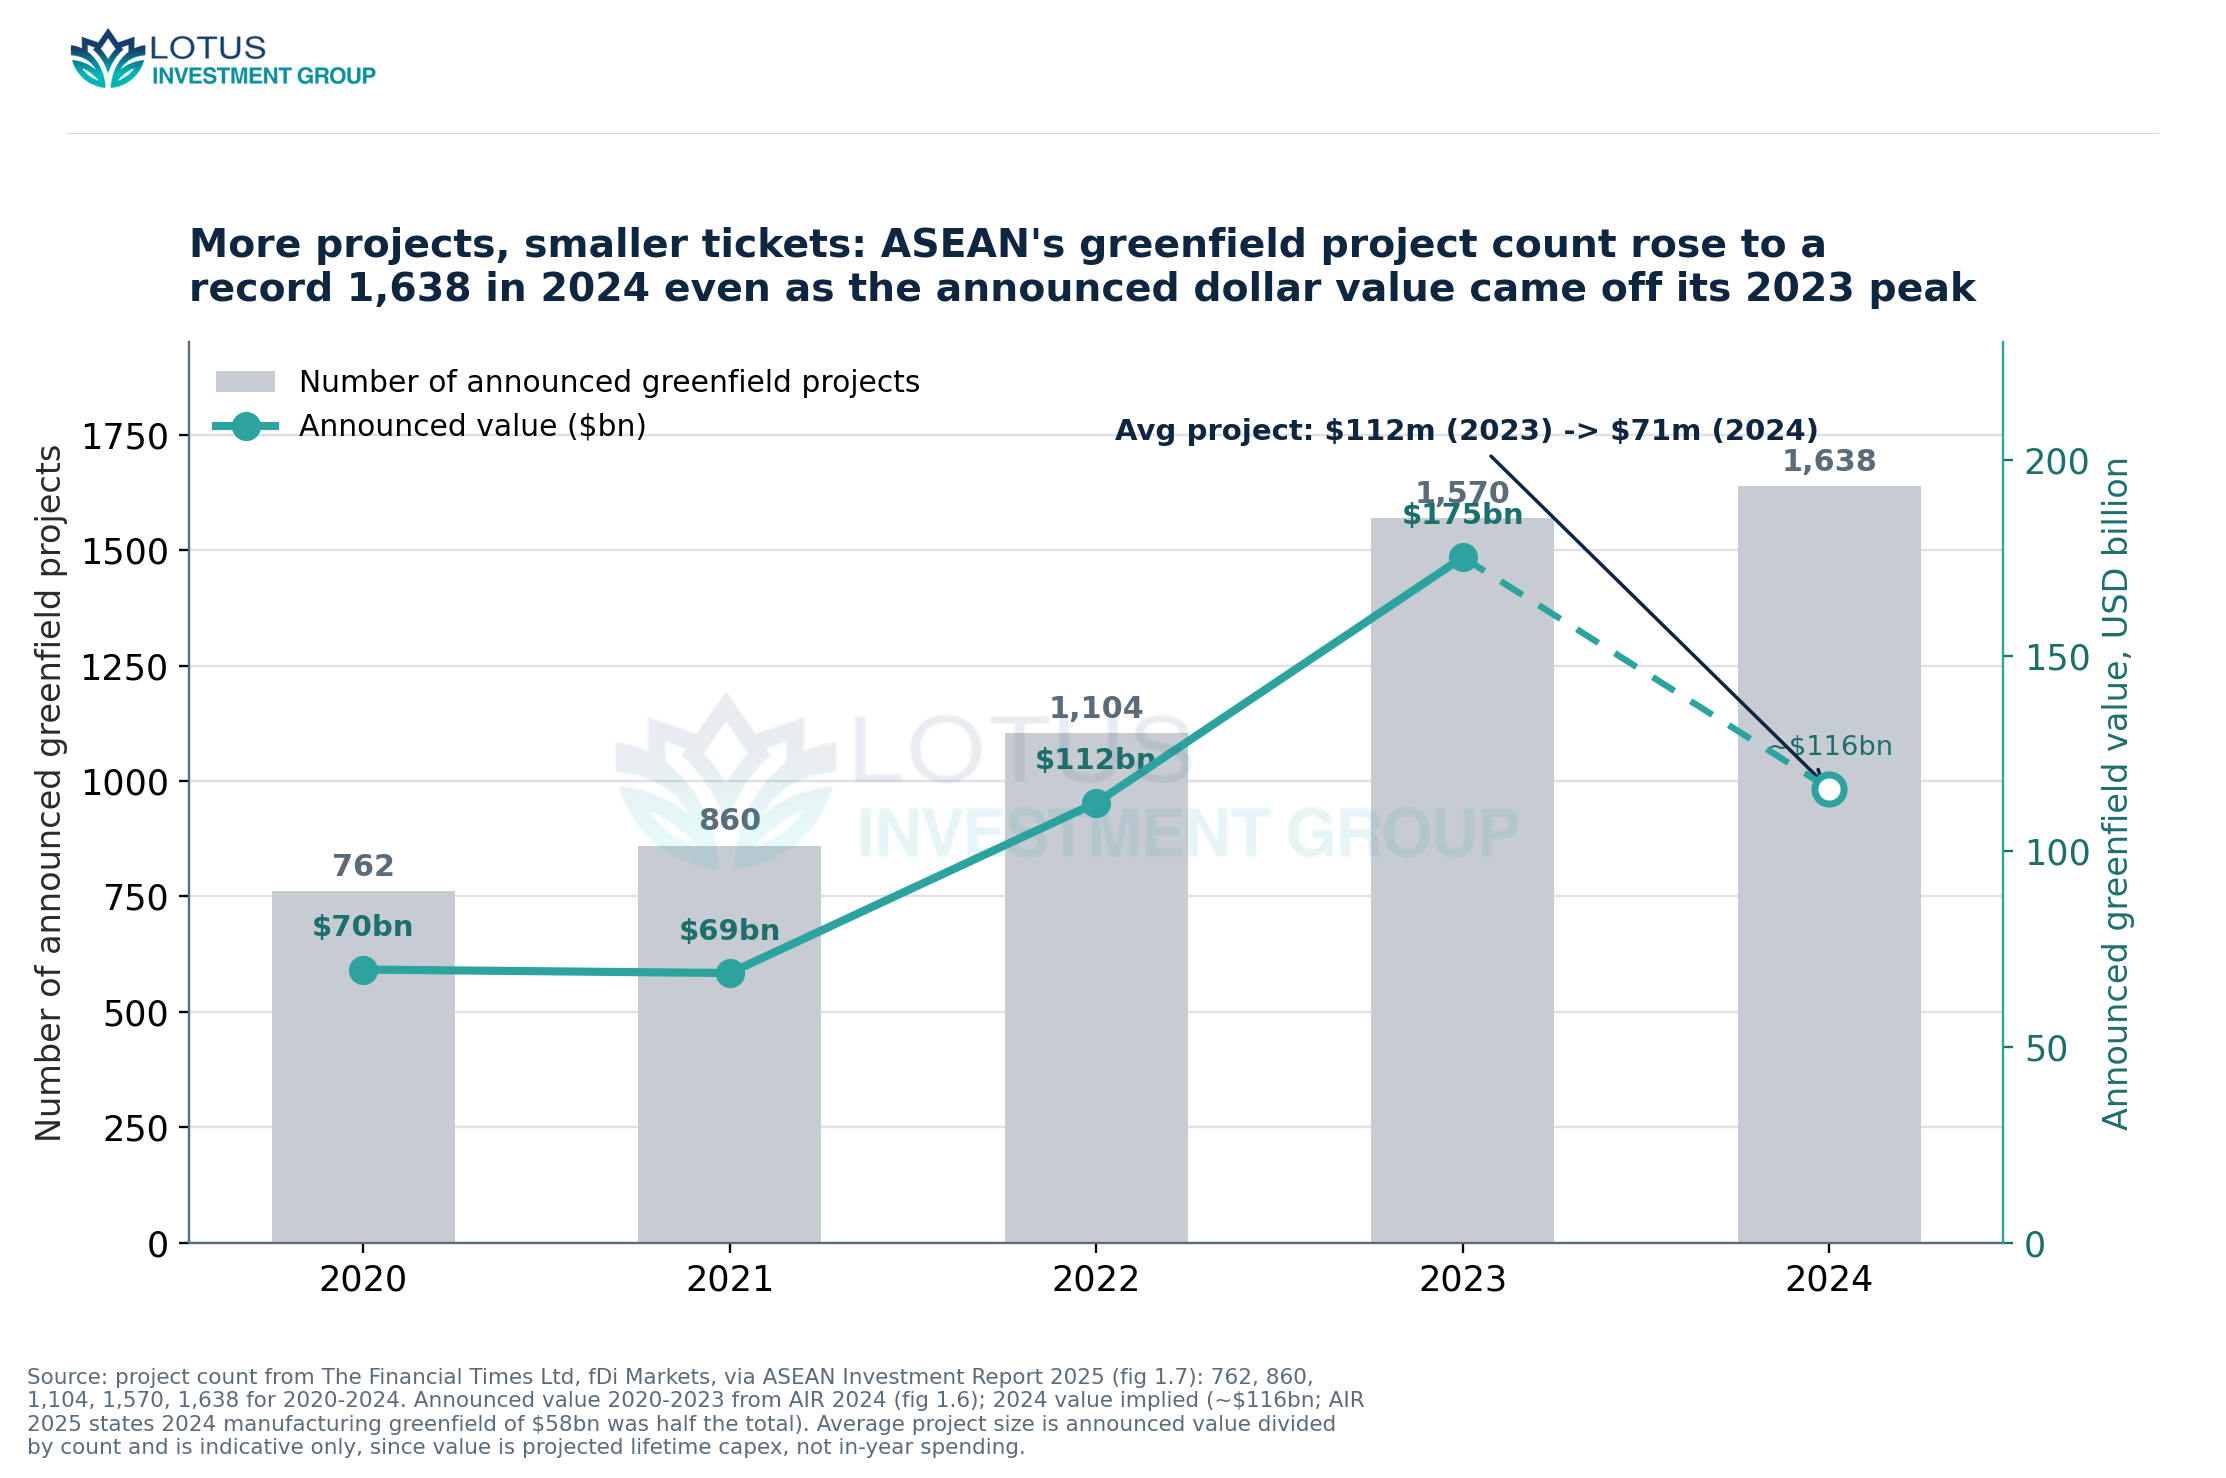
The implied average ticket fell from about USD 112 million per project in 2023 to about USD 71 million in 2024, so the 2024 slippage in value is more projects at smaller scale rather than a retreat. That is consistent with the global pattern UNCTAD reported for the same year, in which greenfield project counts rose 3% while their value fell 5%, holding at USD 1.3 trillion, the second highest on record. A count that keeps climbing while value softens is a pipeline being refilled with smaller, more numerous bets rather than one that is emptying. It is a genuine signal of intent. It is not a settlement schedule, and it does not tell you when, or how completely, the capital arrives.
Reading the two series apart
To an investor or an advisor the divergence is usable rather than annoying, once each series is asked its own question. Greenfield announcements tell you where new productive capacity is being planned and in which industries, which is why they lead in the manufacturing economies of the mainland and the archipelago and say almost nothing about Singapore’s role. Balance-of-payments inflows tell you where equity actually settled, which is why they are a Singapore-and-finance number that flatters the region’s total and understates the physical build-out further down the peninsula. The credibility problem is not in either series. It appears only when the two are placed in one sentence, a record announcement year read as a boom the balance of payments did not confirm, or a record realized total read as a factory wave that was mostly financial equity in one city. The first discipline is to say which number, and the second is to remember that in ASEAN they point at different maps.
Data notes and limits
The announced greenfield value series is from fDi Markets and reflects projected lifetime capital expenditure booked in the announcement year, not in-year spending; the 2020-2023 values are from the ASEAN Investment Report 2024 and the project counts from AIR 2025, and the two reports restate some figures between vintages. The 2024 announced greenfield total of roughly USD 116 billion is implied, not printed: AIR 2025 states that 2024 manufacturing greenfield of USD 58 billion was half the total, and we carry that as an approximation rather than a reported figure. Realized inflows are UNCTAD balance-of-payments FDI as presented in AIR 2025; the 2018-2024 series (146, 165, 118, 212, 231, 208, 226) supersedes the earlier AIR 2024 vintage, which had reported 2023 inflows near USD 230 billion, so the 2023 decline described here rests on the revised figures. Per-country 2024 inflows are as narrated in AIR 2025 and are not converted to a common project basis. The average-project-size figures are announced value divided by count and are indicative only. Throughout, we compare an announcement database with a balance-of-payments series deliberately, and have not netted or reconciled them into a single number, because the reconciliation is exactly what the reporting convention does not support.
Sources
- UNCTAD, World Investment Report 2025, Chapter I (International investment trends), incl. methodology box — Global announced greenfield project value 2024 about USD 1.3 trillion, second highest on record; industrial-sector project count +3% while v
- ASEAN Investment Report 2024 (UNCTAD / ASEAN Secretariat), fig 1.6 and text — ASEAN announced greenfield investment value: USD 69.8bn (2020), USD 68.9bn (2021), USD 112.4bn (2022), USD 175.1bn (2023, record). 2023 valu
- ASEAN Investment Report 2025 (UNCTAD / ASEAN Secretariat), fig 1.7 and section 1.5.1 — ASEAN announced greenfield project count: 762 (2020), 860 (2021), 1,104 (2022), 1,570 (2023), 1,638 (2024, +4%). 2024 manufacturing greenfie
- ASEAN Investment Report 2025 (UNCTAD / ASEAN Secretariat), fig 1, fig 1.3 and overview — ASEAN realized FDI inflows (balance of payments): USD 146bn (2018), 165 (2019), 118 (2020), 212 (2021), 231 (2022), 208 (2023), 226 (2024, +
- ASEAN Investment Report 2025 (UNCTAD / ASEAN Secretariat), per-country 2024 narrative (section 1.2) — 2024 realized FDI inflows by ASEAN member: Singapore USD 143bn (record, +6%; ~63% of ASEAN total; finance USD 87bn = 60% of its inflows; pro
- ASEAN Investment Report 2024 (UNCTAD / ASEAN Secretariat), overview — Earlier vintage reported ASEAN FDI inflows at USD 208bn (2021), 229bn (2022) and USD 230bn (2023, record), superseded by the AIR 2025 revise
