Nâng hạng FTSE thật sự đổi điều gì cho thị trường Việt Nam
June 30, 2026
Food-Processing FDI Outweighs Farm Investment Across Southeast Asia’s Agrifood Sector
July 5, 2026
We read Singapore's place in Asian capital flows from both sides of its direct-investment balance sheet.
At end-2023 the inward stock stood at S$2,858.8 billion, or 4.2 times GDP and about 1.9 times the S$1,535.8 billion Singapore held abroad, and more than half of it (56%, S$1,610.9 billion) sat in holding companies rather than operating assets.
The inflows arrive mainly from the developed West and from Caribbean financial centres; the outflows land disproportionately in Asia, which supplies 21% of what comes in but takes 53% of what goes out.
The composition and the geography are consistent with intermediation: Singapore books foreign capital and re-exports much of it into the region.
Both sides of the balance sheet dwarf the economy
Start with the two totals. At the end of 2023 the stock of foreign direct investment booked in Singapore reached S$2,858.8 billion, and the stock Singapore itself held abroad reached S$1,535.8 billion (Singapore Department of Statistics). Against a nominal GDP of S$673 billion that year (Economic Survey of Singapore 2023), the inward position is 4.2 times the economy and the outward position 2.3 times. Both kept climbing through 2024, to S$3,130.4 billion and S$1,652.8 billion.
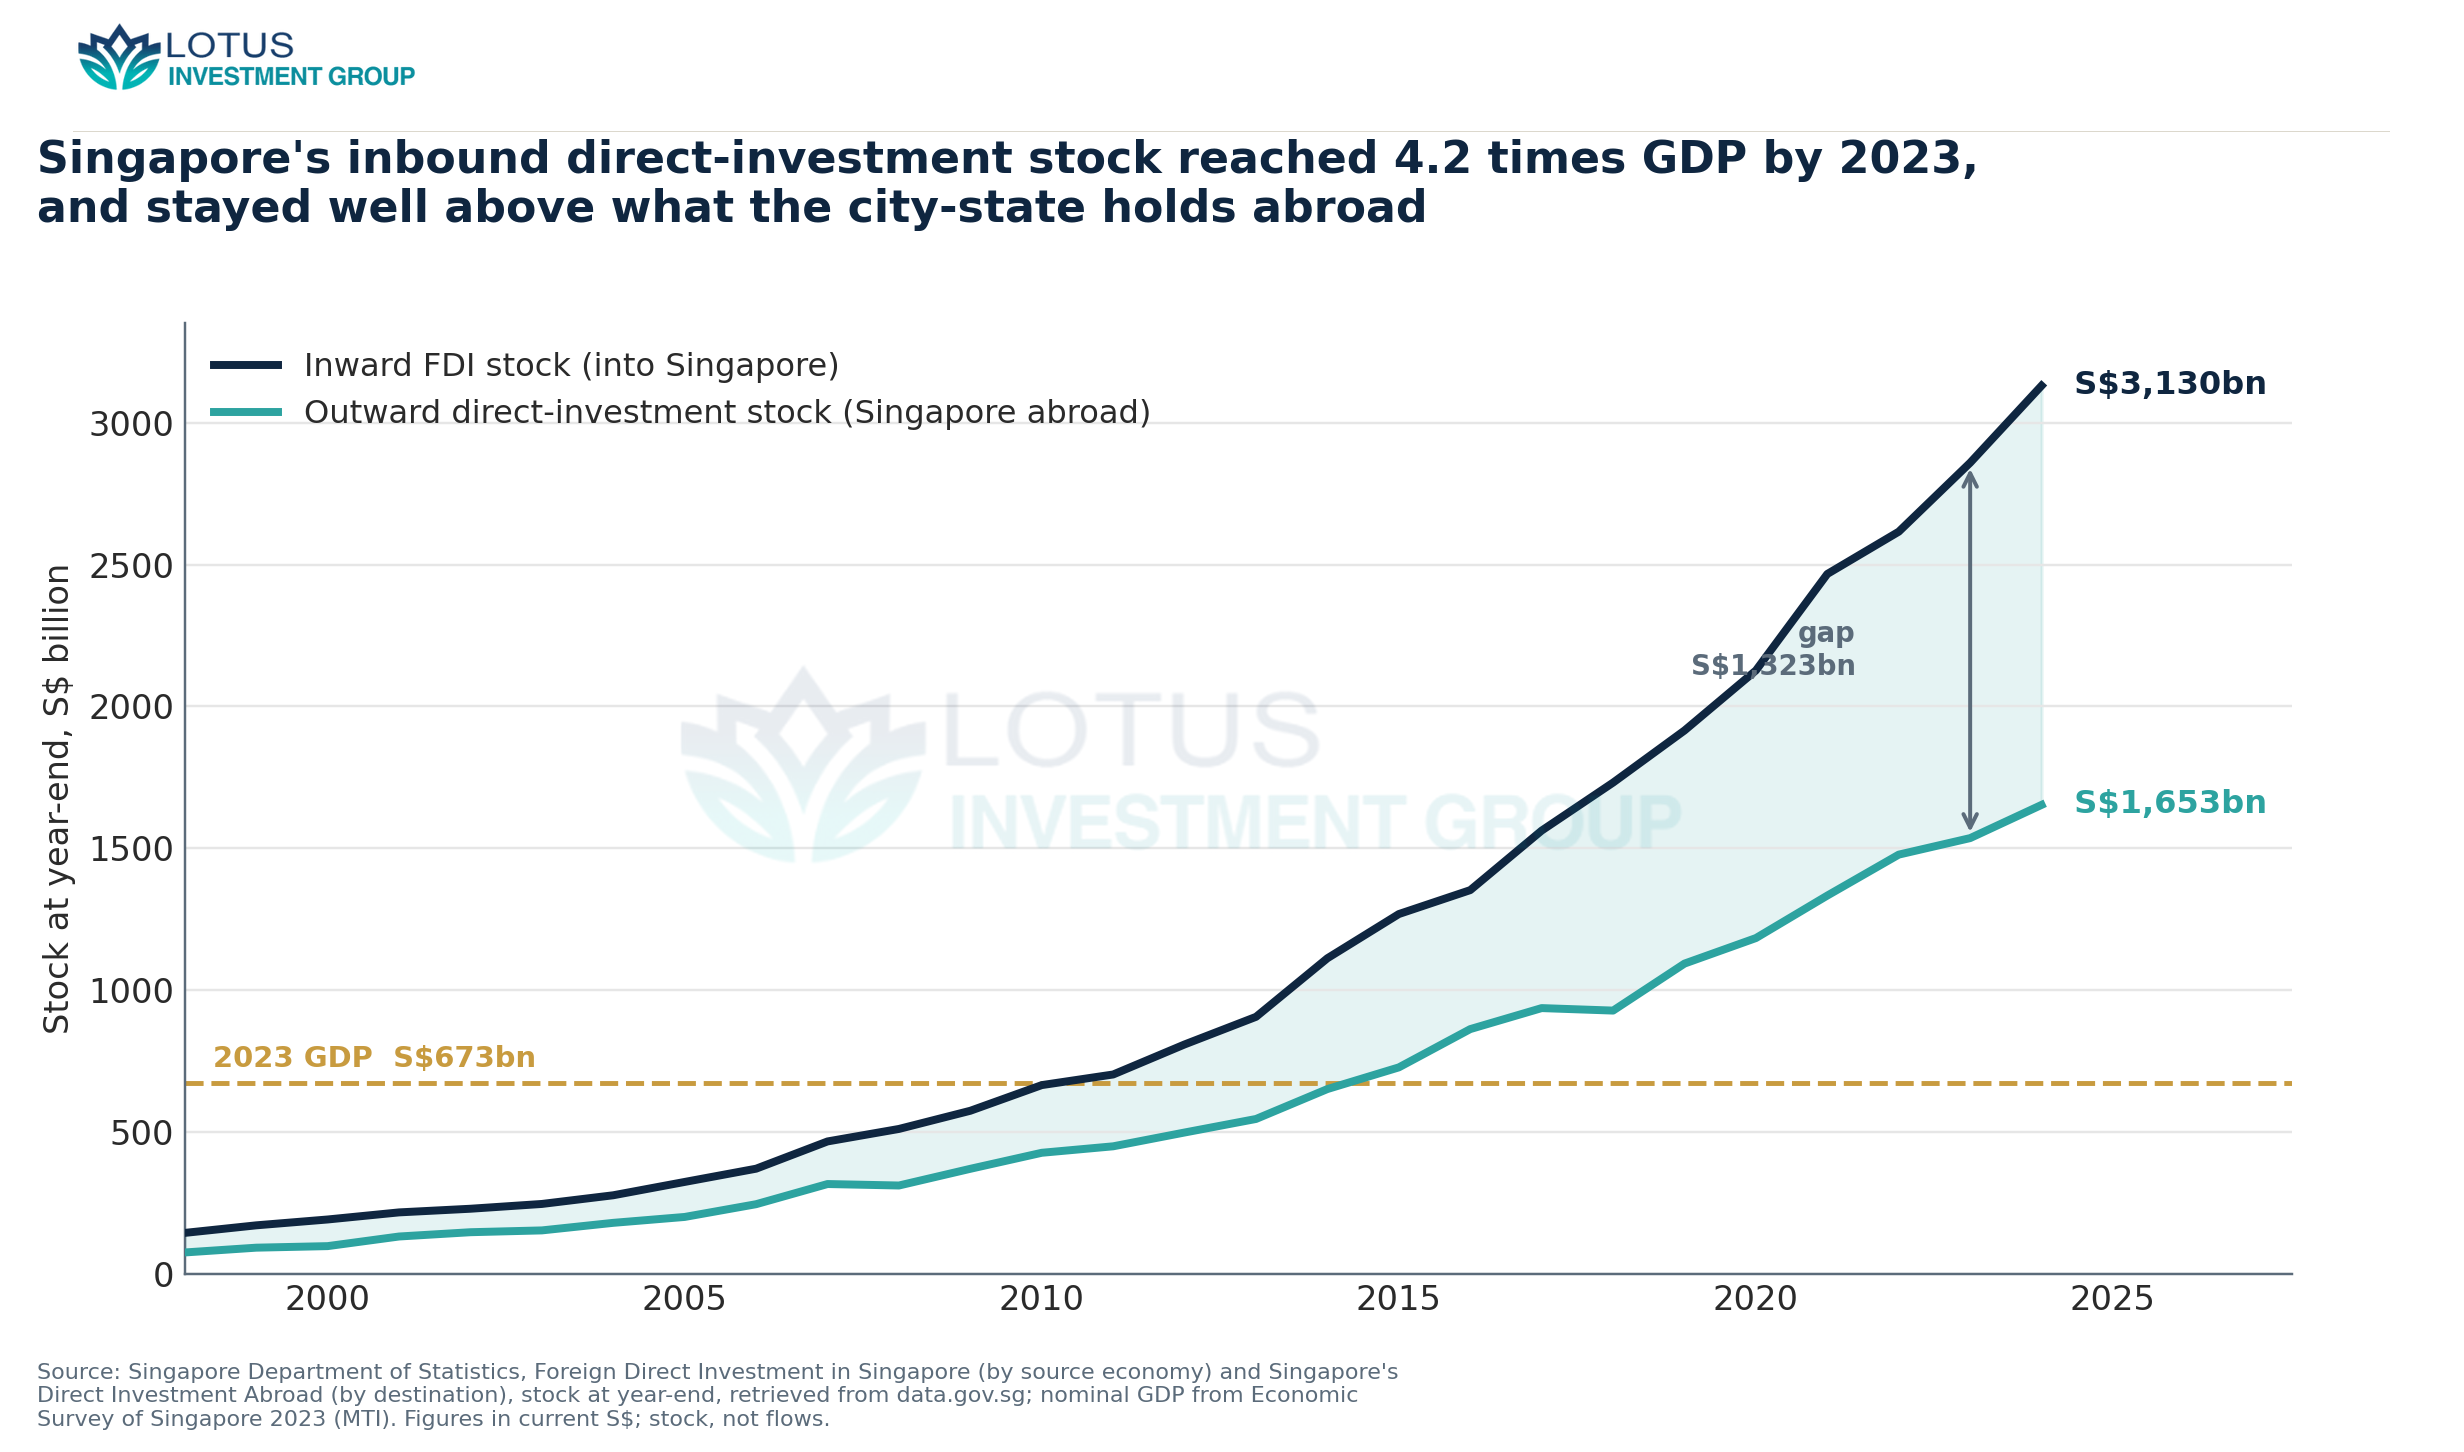
Figure 1 traces the two series back to 1998. The lines separate early and never re-cross: inward stock has exceeded outward stock in every year on record, and the gap widened to S$1,323 billion by end-2023. A country that were only a destination for capital would show a large inward position and a modest outward one; a country that were only an exporter of capital would show the reverse. Singapore shows both positions large, and the inward one larger — the signature of a place that takes capital in and moves a great deal of it on.
The IMF’s Coordinated Direct Investment Survey makes the same point in cross-country terms. Singapore recorded the single largest gain of any economy in the 2023 survey round, its position rising about US$307 billion, or 15% (IMF, 2025). For an economy of 5.92 million residents (Population in Brief 2023), a stock of this size is not explained by what the domestic market can absorb.
More than half the inbound stock is a holding company
What is the inbound capital actually doing? Figure 2 breaks the inward stock by industry. Finance and insurance holds S$1,809.3 billion, 63% of the total. Manufacturing, the activity most people picture when they hear the words “foreign investment,” holds S$262.8 billion, or 9%. Wholesale and retail trade, dominated by the commodity-trading houses that domicile in Singapore, holds another S$433.7 billion.
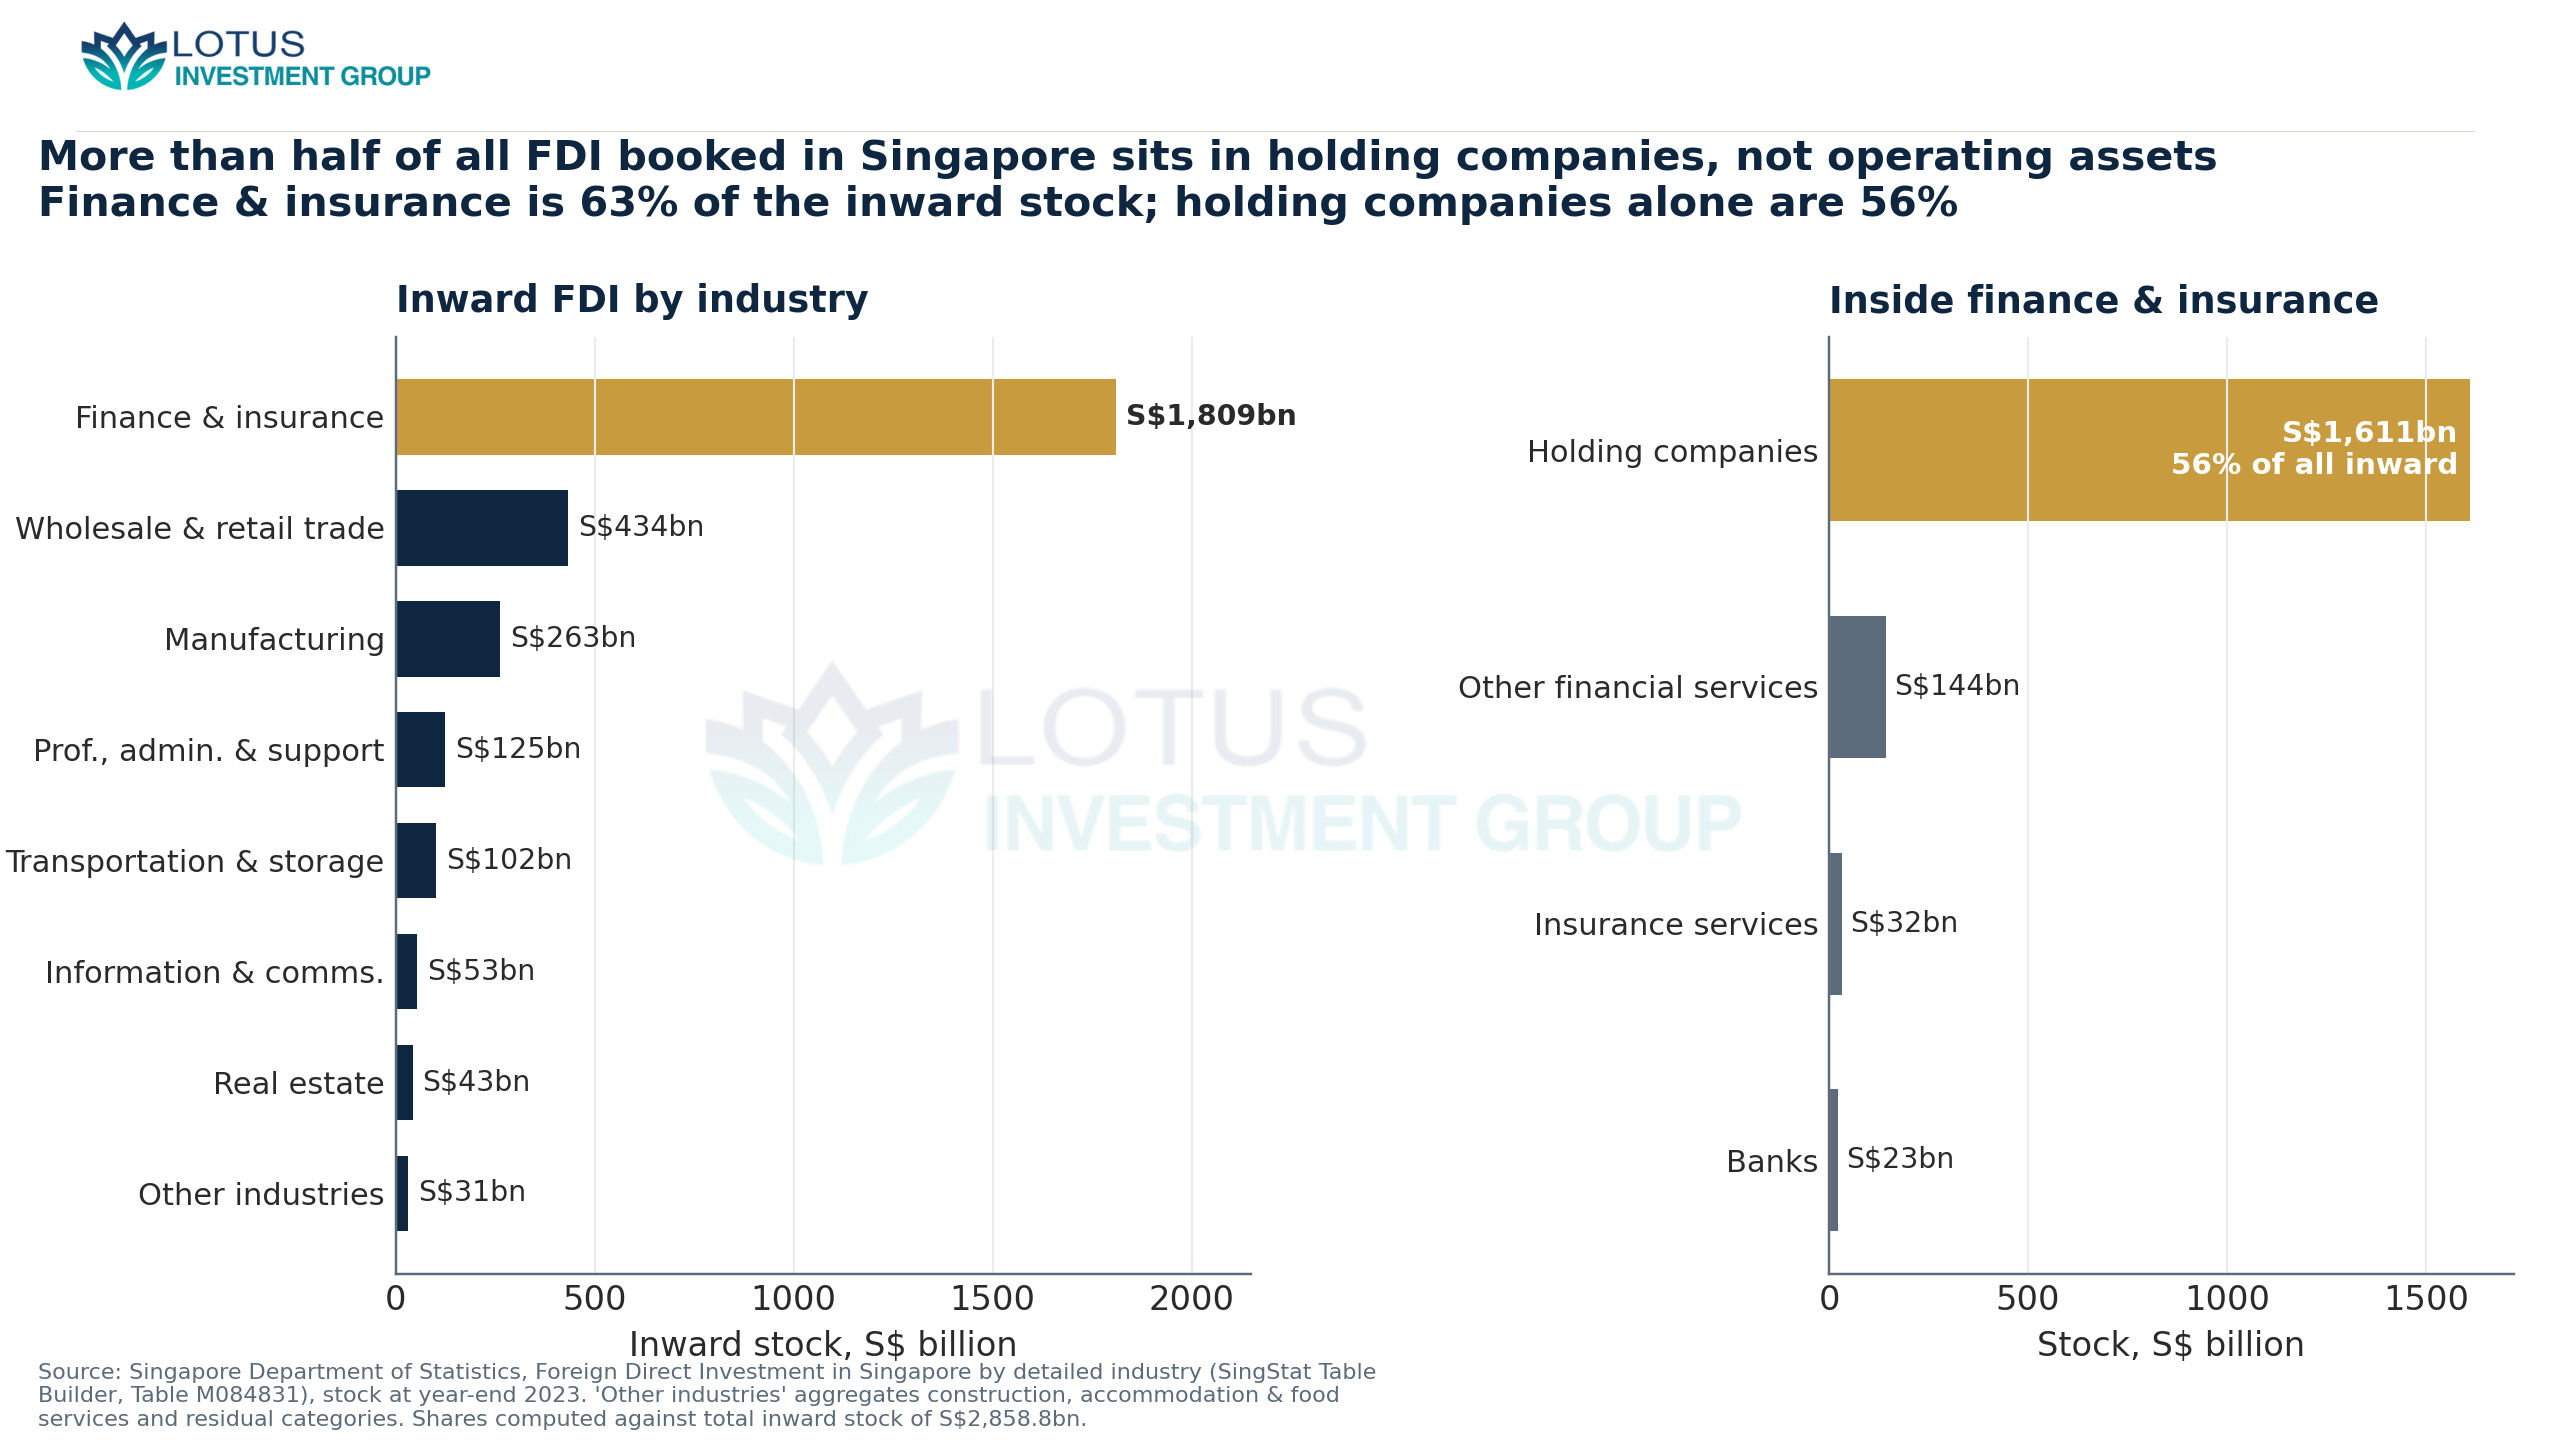
Inside finance and insurance, the dominant line is not banks (S$22.5 billion) or insurers (S$31.7 billion) but holding companies, at S$1,610.9 billion. That single category is 56% of all foreign direct investment booked in Singapore. A holding company is a balance sheet, not a factory; its assets are stakes in other companies, frequently in other countries. When more than half of a jurisdiction’s inbound direct-investment stock sits in such vehicles, the recorded “investment into Singapore” is in large part capital staged in Singapore for deployment elsewhere. This is the mechanism Damgaard, Elkjaer and Johannesen (IMF, 2019) called phantom investment — positions that pass through corporate shells in financial centres. Singapore’s inbound book is not phantom in that pejorative sense: the vehicles are substantive and taxed. But the composition tells you the stock is an intermediation ledger at least as much as a record of productive assets.
The money arrives from the West and the Caribbean
Figure 3 ranks the inbound stock by immediate source. The United States leads at S$702.7 billion. The next two are the Cayman Islands (S$316.7 billion) and the British Virgin Islands (S$200.4 billion) — jurisdictions with no operating economy to speak of, ranked above Japan, the United Kingdom and mainland China. Luxembourg, Hong Kong, Bermuda, the Netherlands and Switzerland fill out most of the rest. The four Caribbean centres alone (Cayman, the BVI, Bermuda, the Bahamas) sum to S$659 billion, 23% of the inbound total.
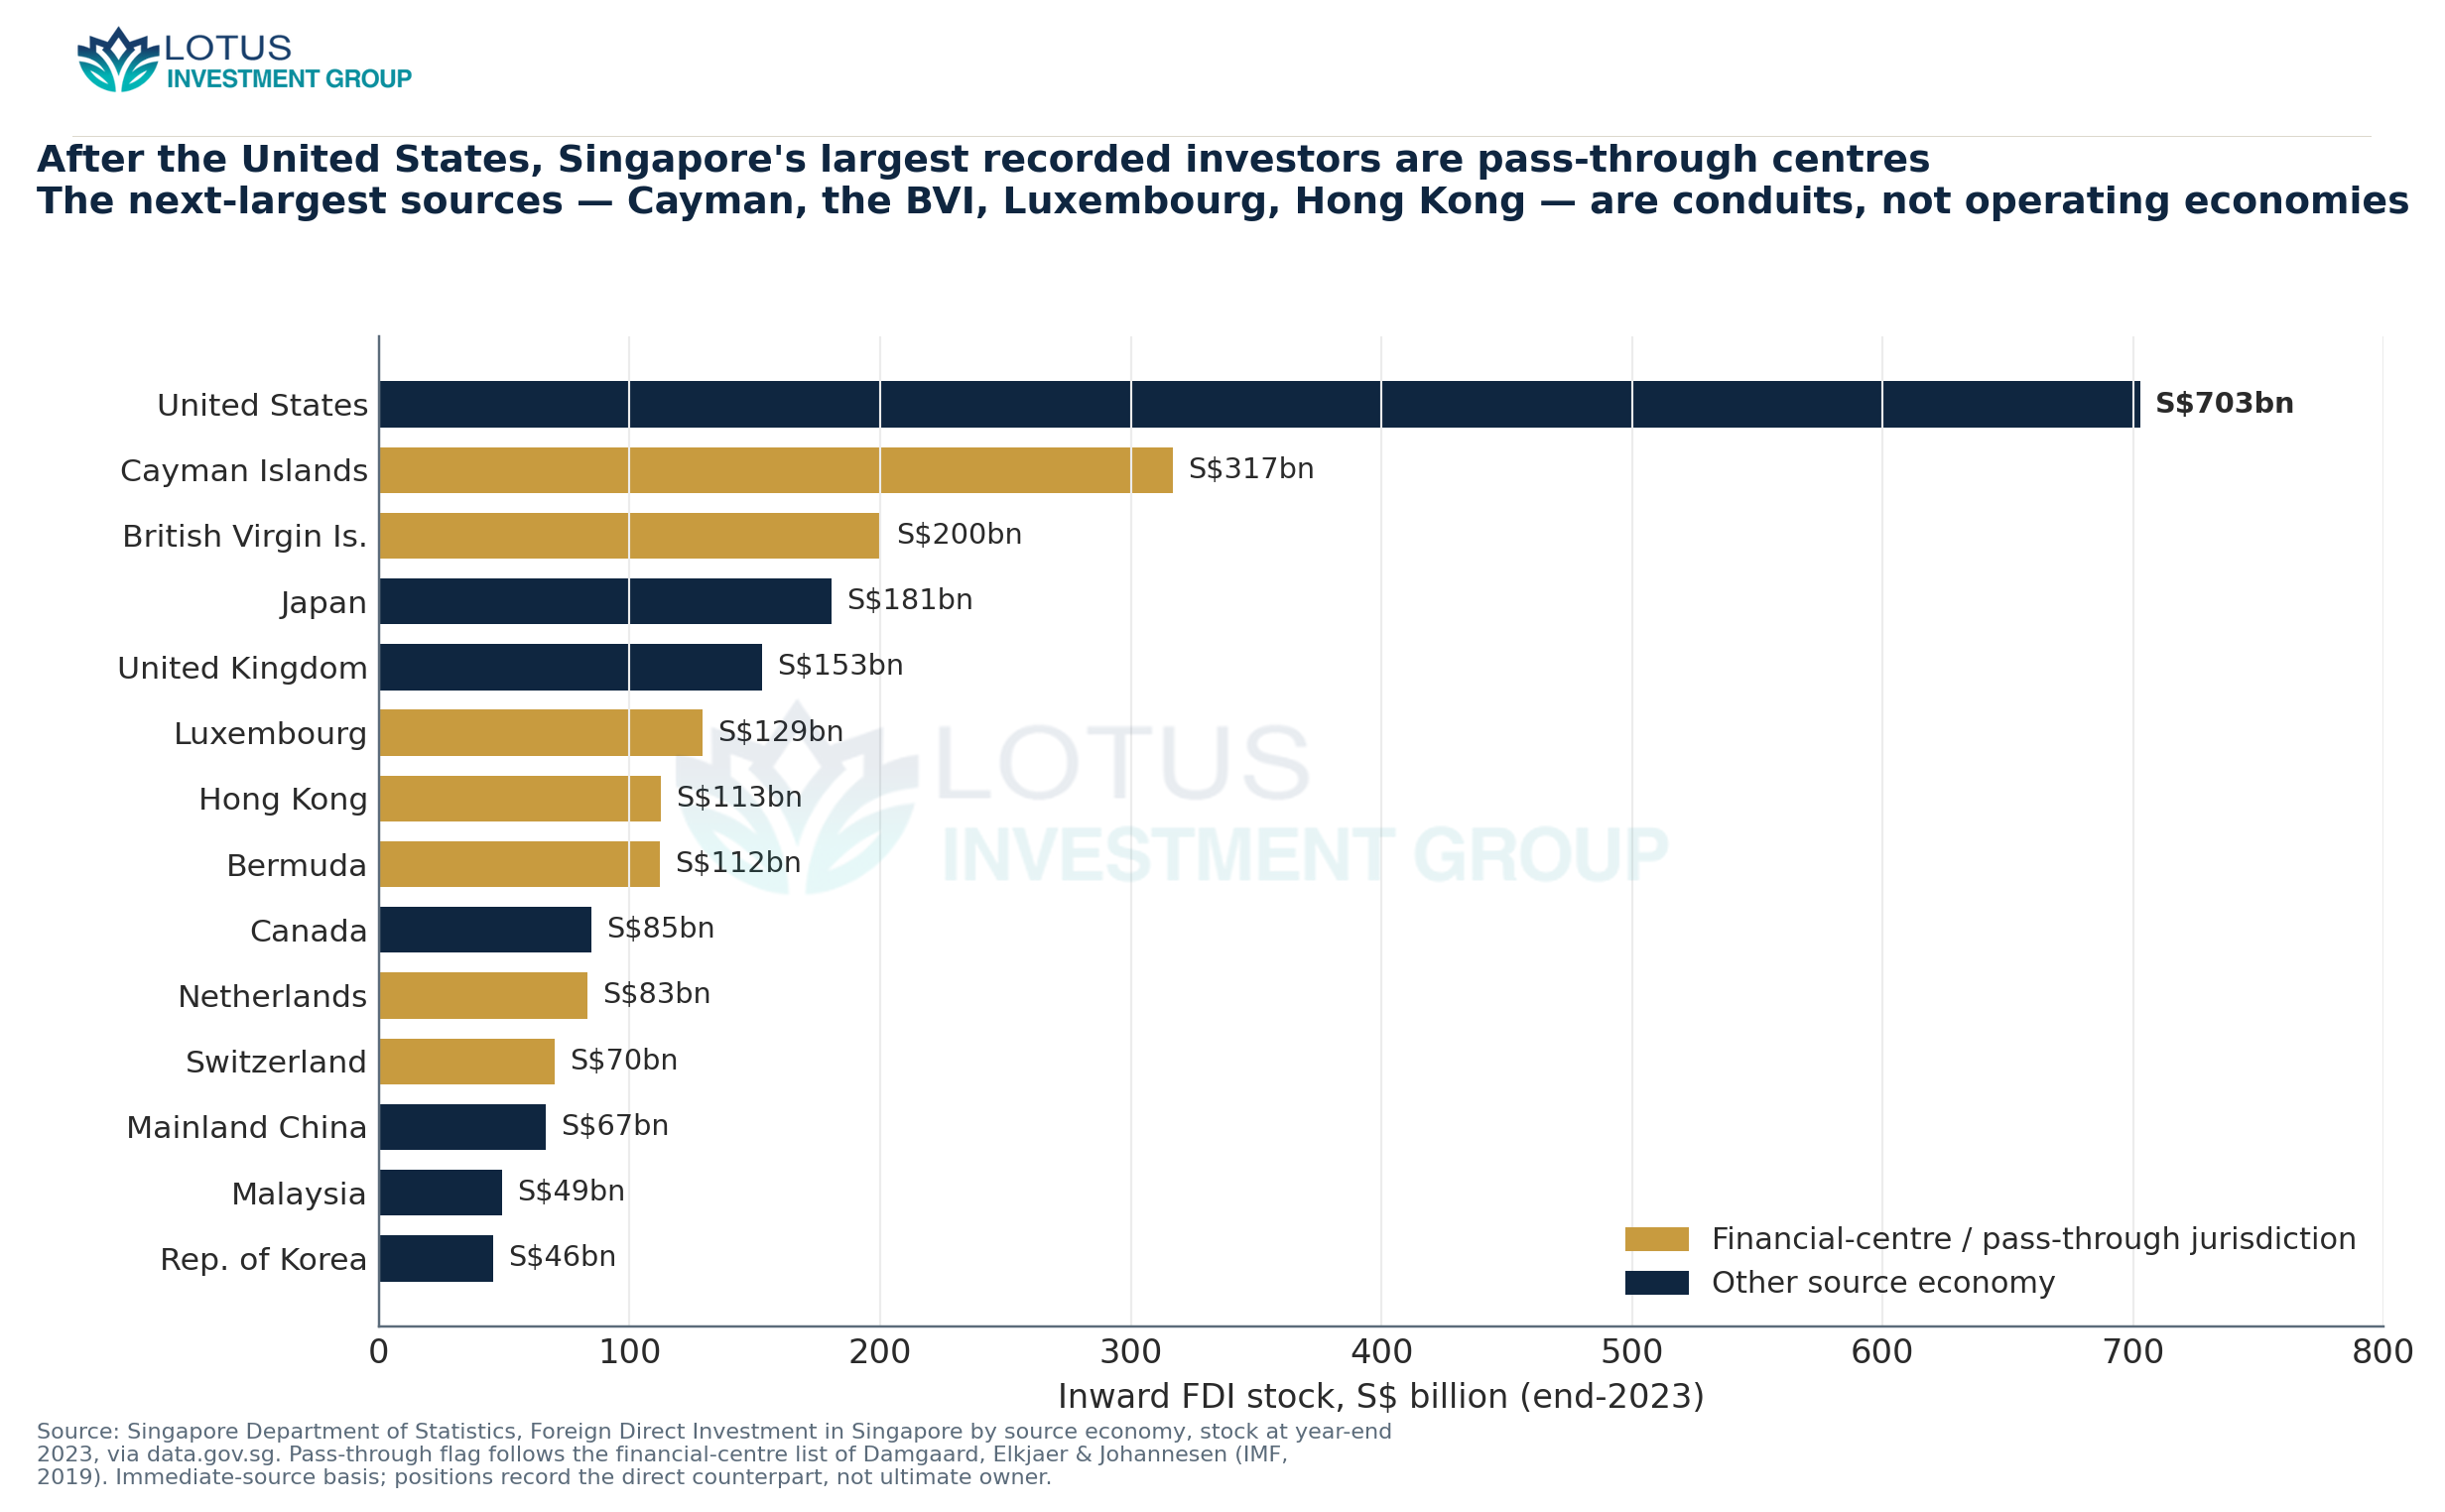
These positions are recorded on an immediate-counterpart basis, so they name the last stop before Singapore, not the ultimate owner. That caveat cuts in a specific direction. Capital booked as arriving “from the Cayman Islands” almost never originates there, so the high ranking of pass-through centres is itself the evidence that Singapore sits well inside the plumbing, receiving capital that has already been routed at least once before it lands.
It leaves, disproportionately, for Asia
The re-export becomes visible when the two sides are compared by region. Figure 4 places the source of every inbound dollar on the left and the destination of every outbound dollar on the right, each as a share of its own total. The asymmetry is the finding. North America supplies 28% of the inflows but takes just 4% of the outflows. Europe is roughly balanced, near a quarter on each side. Asia runs the other way entirely: it is the source of 21% of what enters Singapore and the destination of 53% of what leaves. The Caribbean-heavy South and Central America grouping supplies 23% of inflows and receives 12% of outflows.
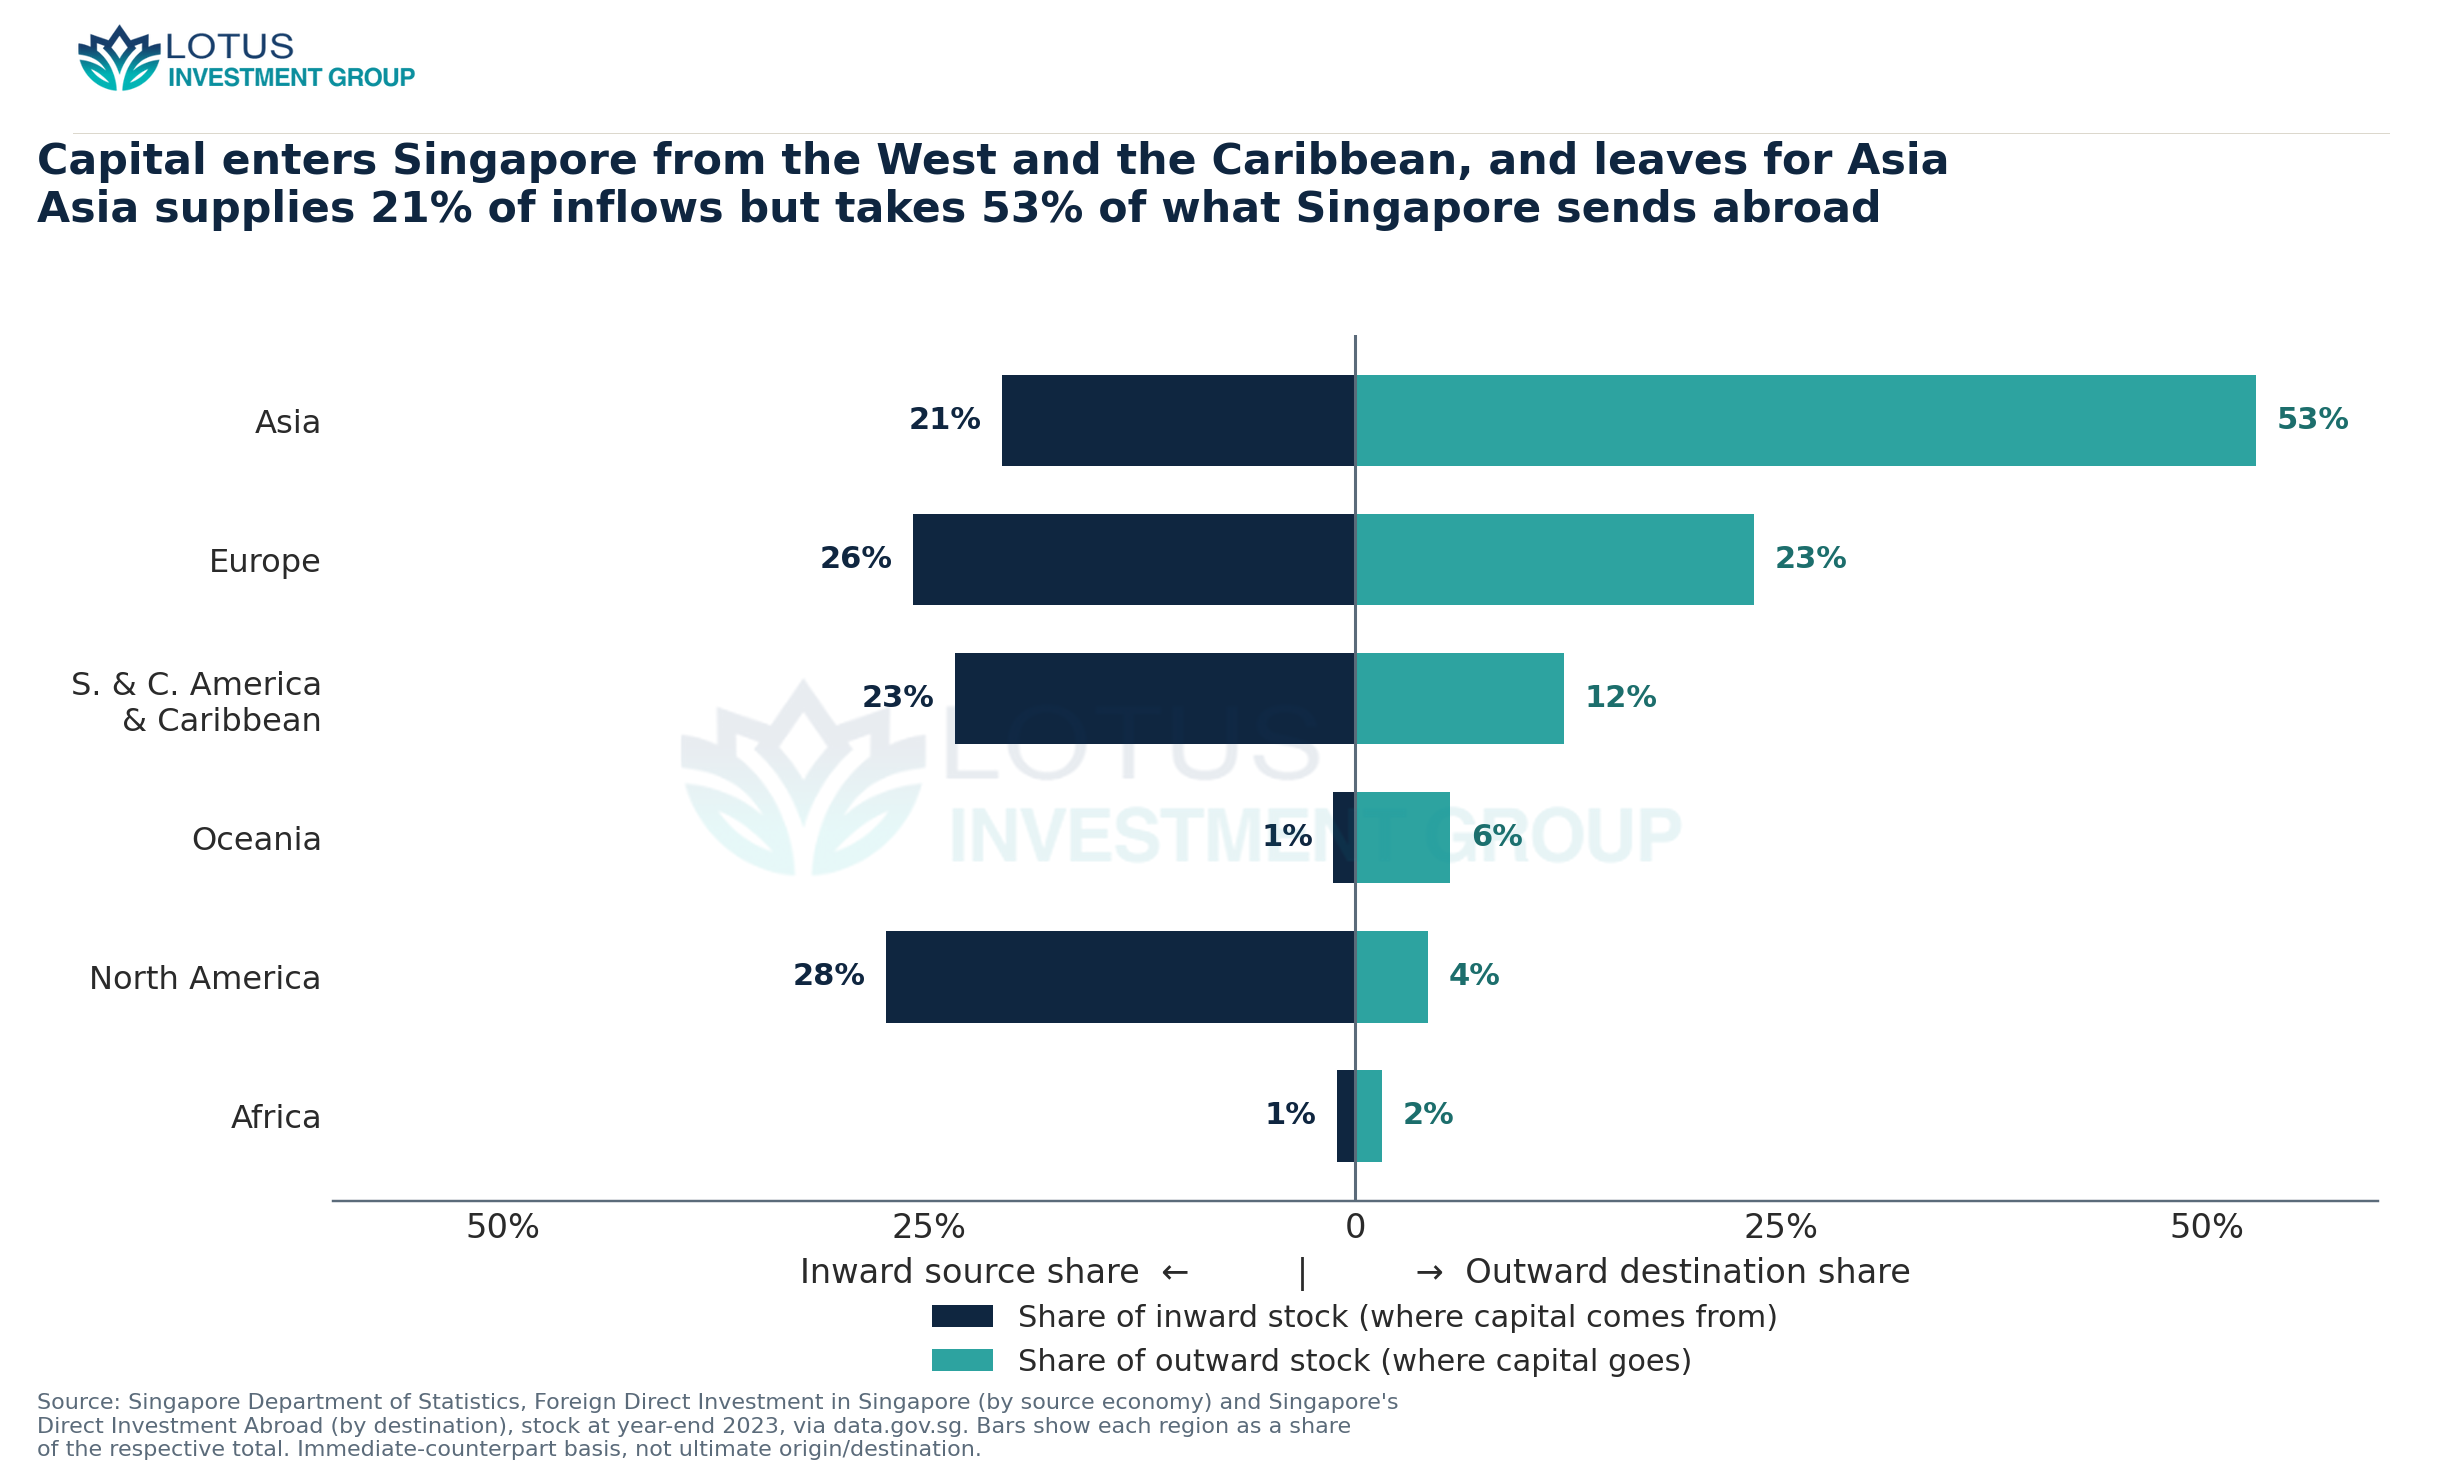
Read the two columns together and the transformation is legible. Capital enters heavily from the developed West and from offshore centres, and departs heavily for Asia. Singapore is where a dollar raised in New York or parked in George Town becomes a dollar invested in Jakarta or Ho Chi Minh City. The gross-up matters as much as the redirection: because the inward and outward books are both larger than GDP, the redirection runs at a scale no domestic saving pool could fund.
The onward leg lands next door
For investors in Southeast Asia the relevant question is where that onward Asian dollar goes. Figure 5 tracks Singapore’s outward direct-investment stock in the five largest ASEAN hosts from 2015 to 2024. Indonesia is the largest at S$104.3 billion, followed by Malaysia (S$75.6 billion), Thailand and Vietnam (about S$48 billion each) and the Philippines (S$13.8 billion). Total Singapore outward stock in ASEAN was S$273.4 billion at end-2023, and mainland China, at S$225.2 billion, is the single largest destination overall.
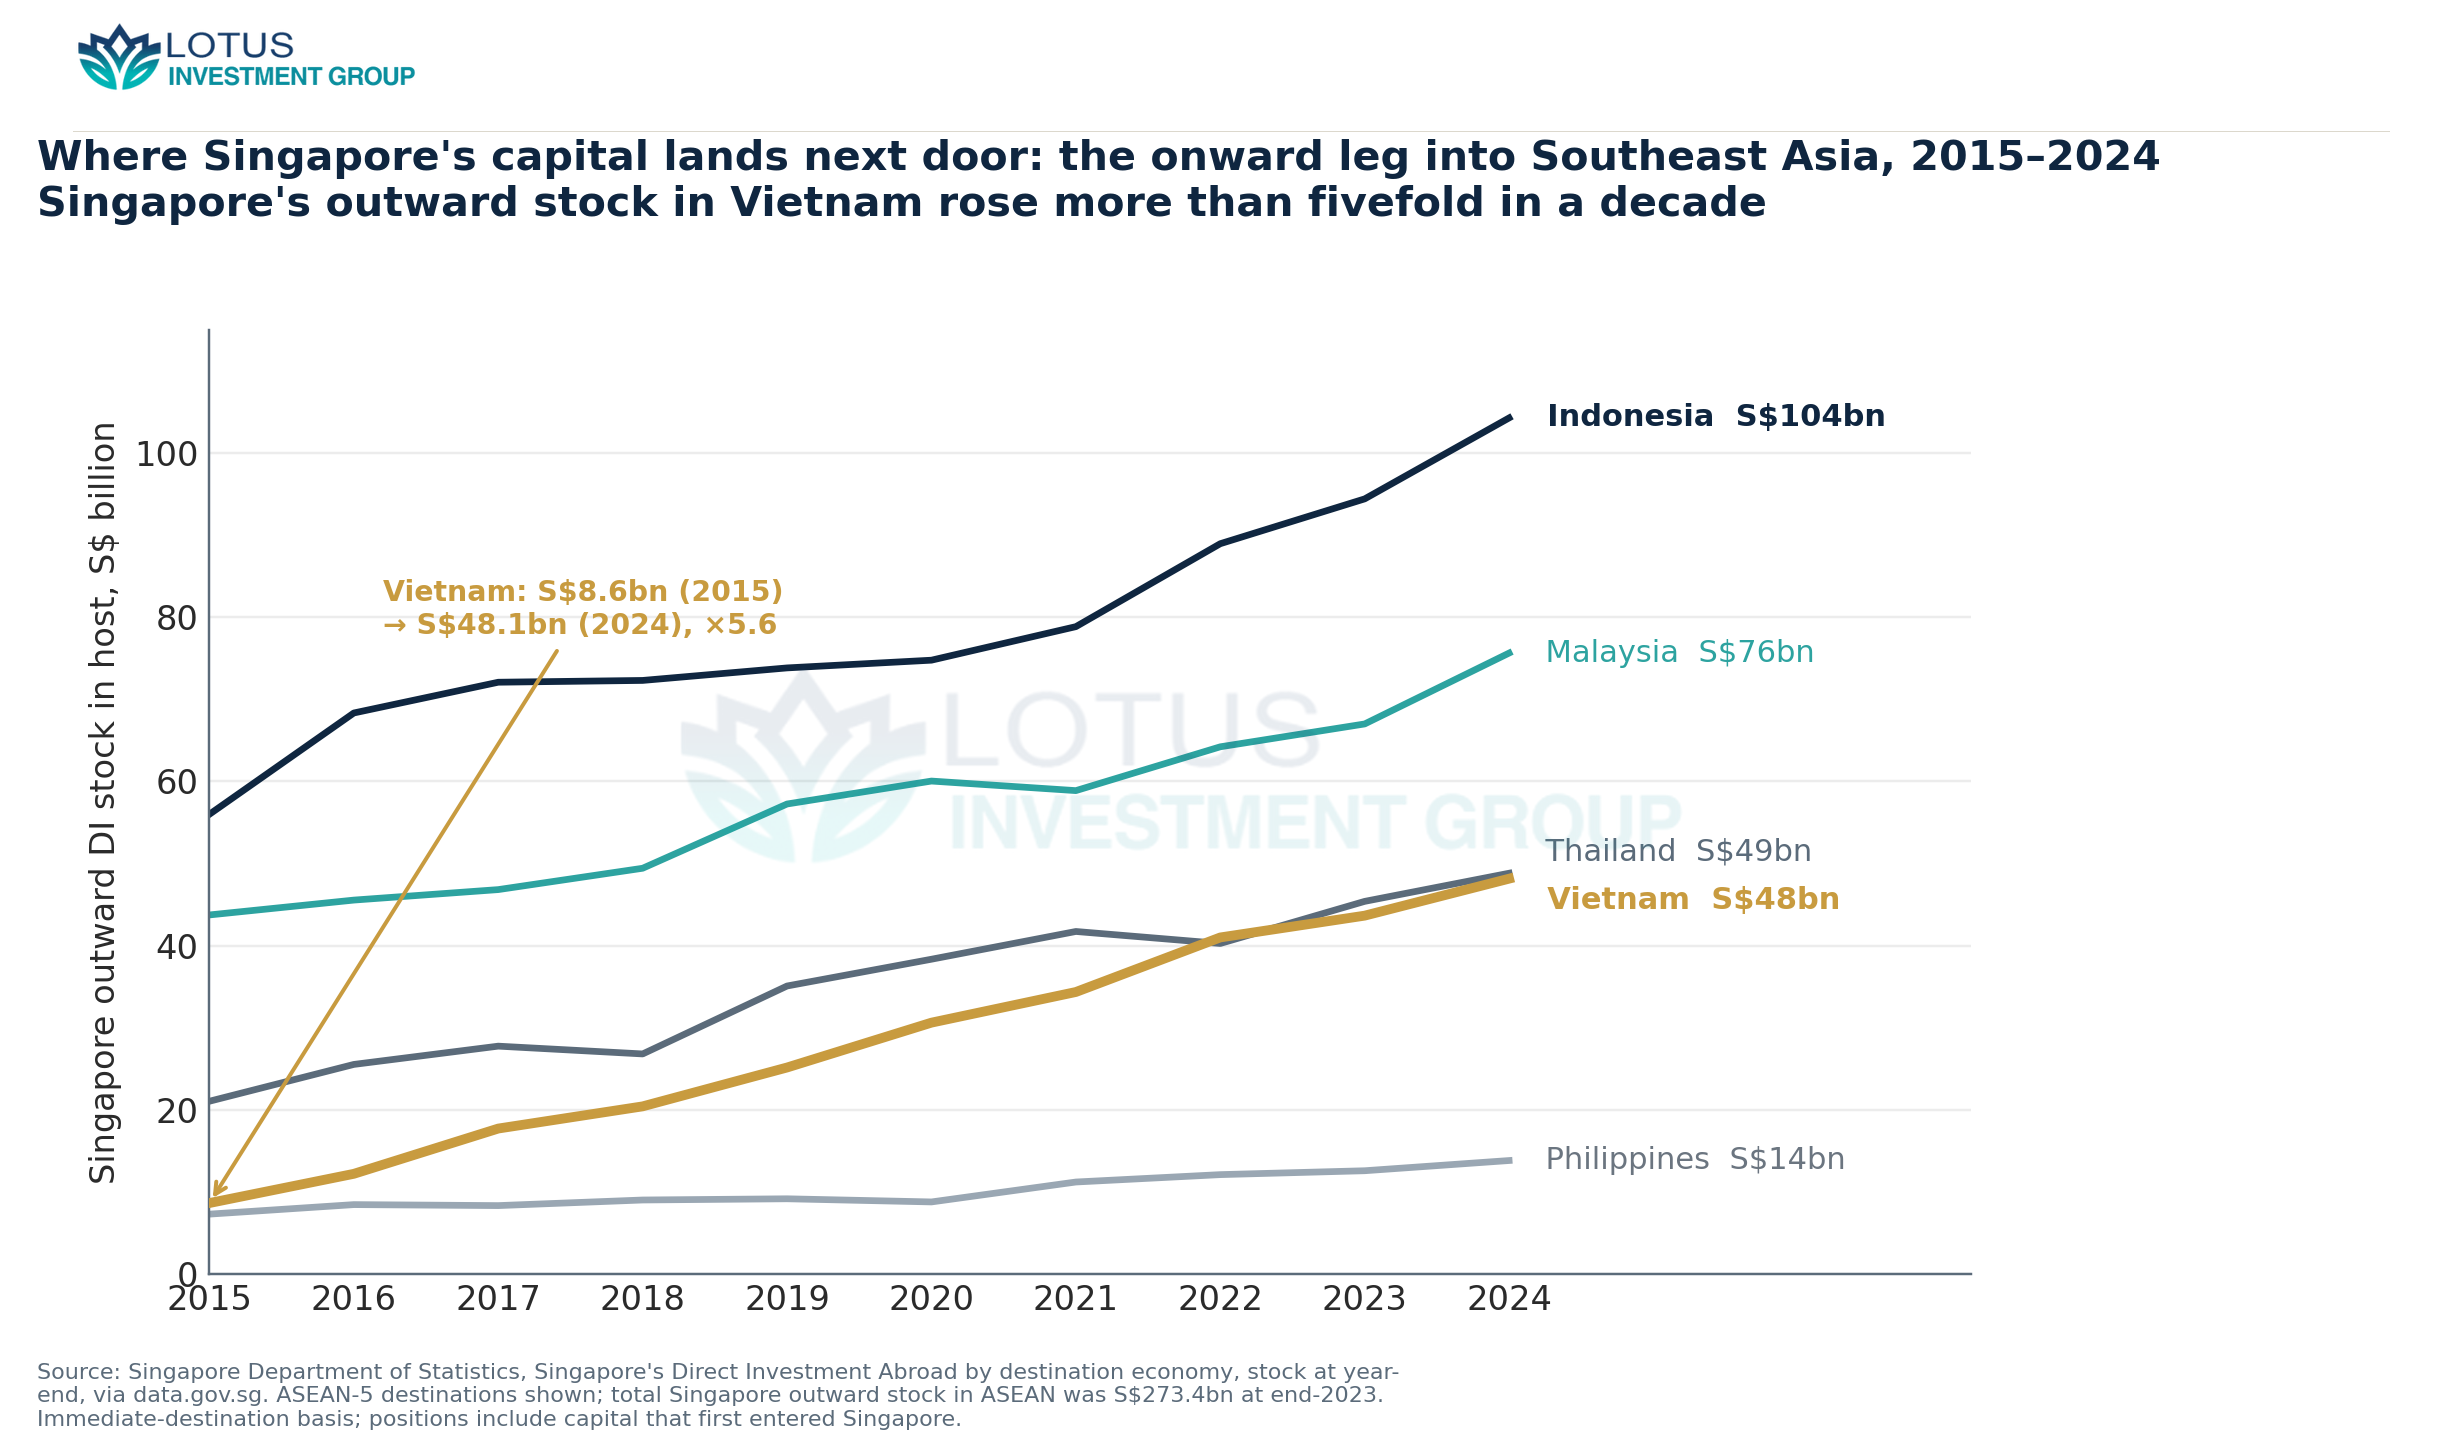
Vietnam is the steepest line. Singapore’s outward stock there rose from S$8.6 billion in 2015 to S$48.1 billion in 2024, more than fivefold. This is the number that matters for reading regional FDI tables. When Singapore appears as the top recorded source of investment into Vietnam or Indonesia, as it does in most years, a large share of that “Singaporean” capital is money that entered Singapore from elsewhere and continued on. The city-state is the counterparty of record, not necessarily the counterparty of origin, and a bilateral table that stops at the immediate source will over-credit Singapore and under-credit whoever stands behind the holding company.
Data notes and limits
All positions are stocks at year-end, not annual flows, and are stated in current Singapore dollars from the Department of Statistics unless noted; the IMF cross-country comparison is in US dollars. Both the inward and outward series are compiled on an immediate-counterpart basis, so they identify the direct partner in a transaction rather than the ultimate source or ultimate host — which is precisely why the balance sheet can be read as intermediation rather than as a claim about who ultimately owns or benefits. Negative entries in the raw data (Vietnam shows −S$144 million of inward stock in 2023) reflect reverse investment and intra-group lending that nets below zero, not withdrawn assets. The industry split classifies by the industry of the Singapore entity that books the investment, so a holding company inside “finance and insurance” may sit atop manufacturing assets abroad. None of these caveats disturbs the central magnitudes: an inbound stock of 4.2 times GDP, a majority of it in holding companies, and an outbound book pointed at Asia.
Sources
- Singapore Department of Statistics, Foreign Direct Investment in Singapore by Source Economy (Stock as at Year-End), Annual — via data.gov.sg — Inward FDI stock in Singapore, total S$2,858.8bn (end-2023) and S$3,130.4bn (end-2024); by source economy (US S$702.7bn, Cayman S$316.7bn, B
- Singapore Department of Statistics, Foreign Direct Investment In Singapore By Detailed Industry (Stock as at Year-End), Annual — SingStat Table Builder, Table M084831 (data last updated 23/03/2026) — Inward FDI in Singapore by detailed industry, end-2023: Finance & insurance S$1,809.3bn (63%); Holding companies S$1,610.9bn (56% of total i
- Singapore Department of Statistics, Singapore's Direct Investment Abroad by Destination Economy and Industry Abroad (Stock as at Year-End), Annual — via data.gov.sg — Singapore's Direct Investment Abroad, total S$1,535.8bn (end-2023) and S$1,652.8bn (end-2024); by region Asia S$811.9bn/53%, Europe S$359.7b
- Ministry of Trade and Industry / Singapore Department of Statistics, Economic Survey of Singapore 2023 — Singapore nominal GDP at current market prices was S$673 billion in 2023.
- IMF, "Foreign Direct Investment Increased to a Record $41 Trillion" (IMF Blog, 20 Feb 2025) — In the 2023 CDIS round, Singapore recorded the largest gain of any economy, its direct-investment position rising about US$307 billion, a 15
- Jannick Damgaard, Thomas Elkjaer & Niels Johannesen, "The Rise of Phantom Investments," IMF Finance & Development, Sept 2019 — Concept of phantom investment / capital routed through corporate shells in financial-centre jurisdictions; financial-centre classification.
- National Population and Talent Division / SingStat, Population in Brief 2023 — Singapore's total population was 5.92 million as at June 2023.
